Tropical Disturbance Climatology
[ Comparision Tables between Development Regions ]
[ Graph of Probabilities at 6 hourly Intervals ]
[ Detection Rate of Tropical Cyclones by Lead-time ]
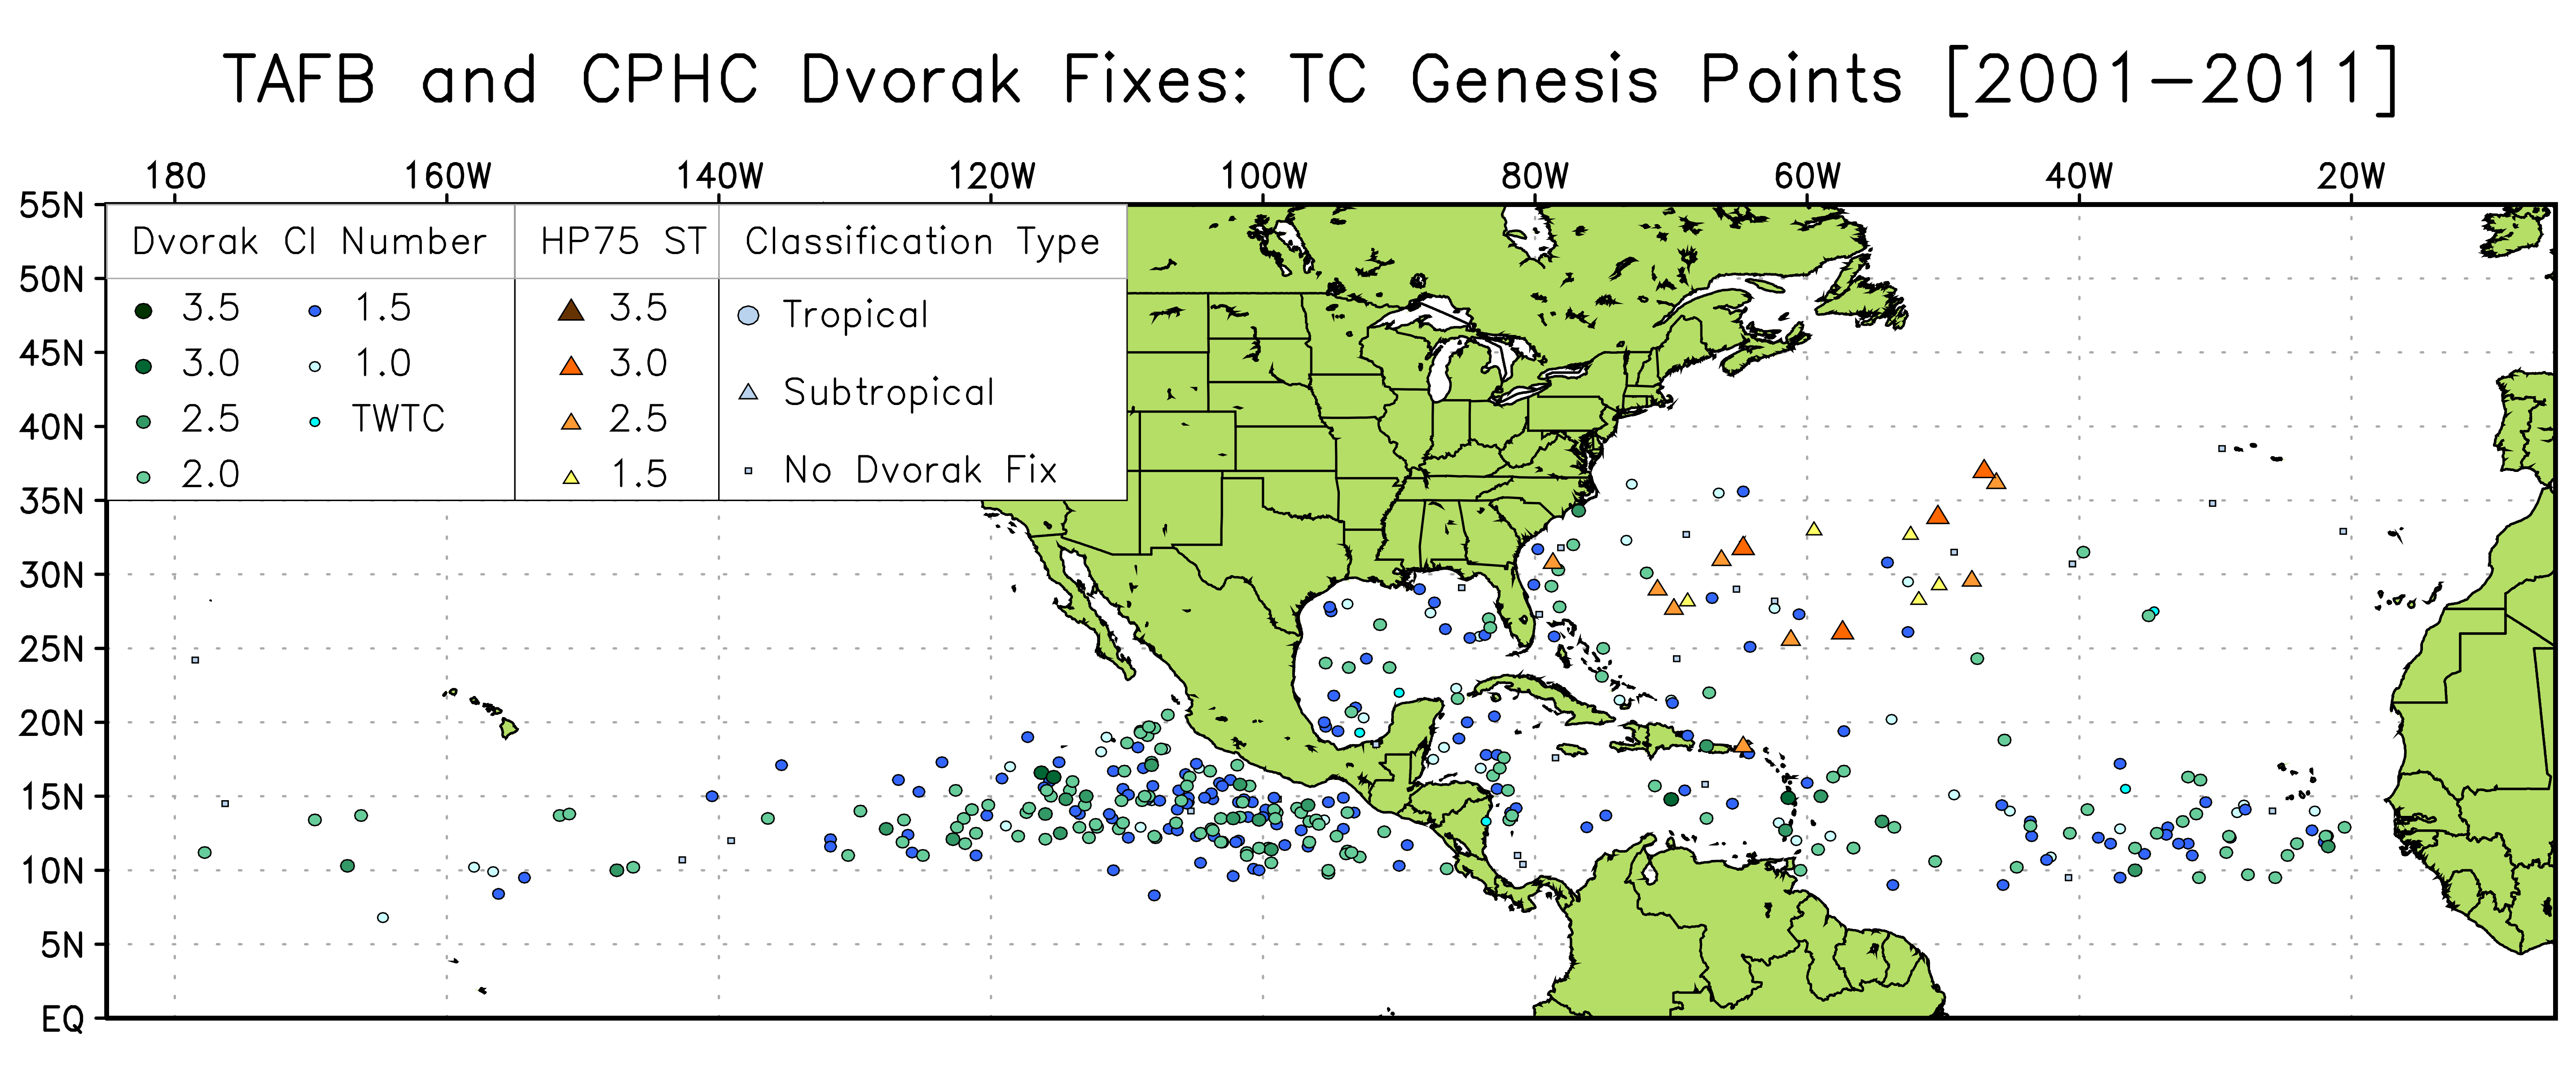
[ Locations of Historical Dvorak Analyses ]
The center position and intensity for every Dvorak fix in our database (from TAFB in the Atlantic and TAFB [CPHC] in the eastern [central] North Pacific) is plotted in the maps below. The marker shape represents if the tropical system eventually underwent genesis (and if so, whether it is a tropical or subtropical observation). The marker color represents the Dvorak CI number, with higher values plotted on top and a separate color scale for subtropical systems as designated by the Hebert and Poteat (1975) technique. The middle figure shows only those cases that were tropical disturbances (that either did not develop further, or before genesis). The bottom figure shows the tropical cyclone best track genesis points, with the smallest gray dots representing no Dvorak fix at the time of genesis.