Tropical Disturbance Climatology
[ Comparision Tables between Development Regions ]
[ Graph of Probabilities at 6 hourly Intervals ]
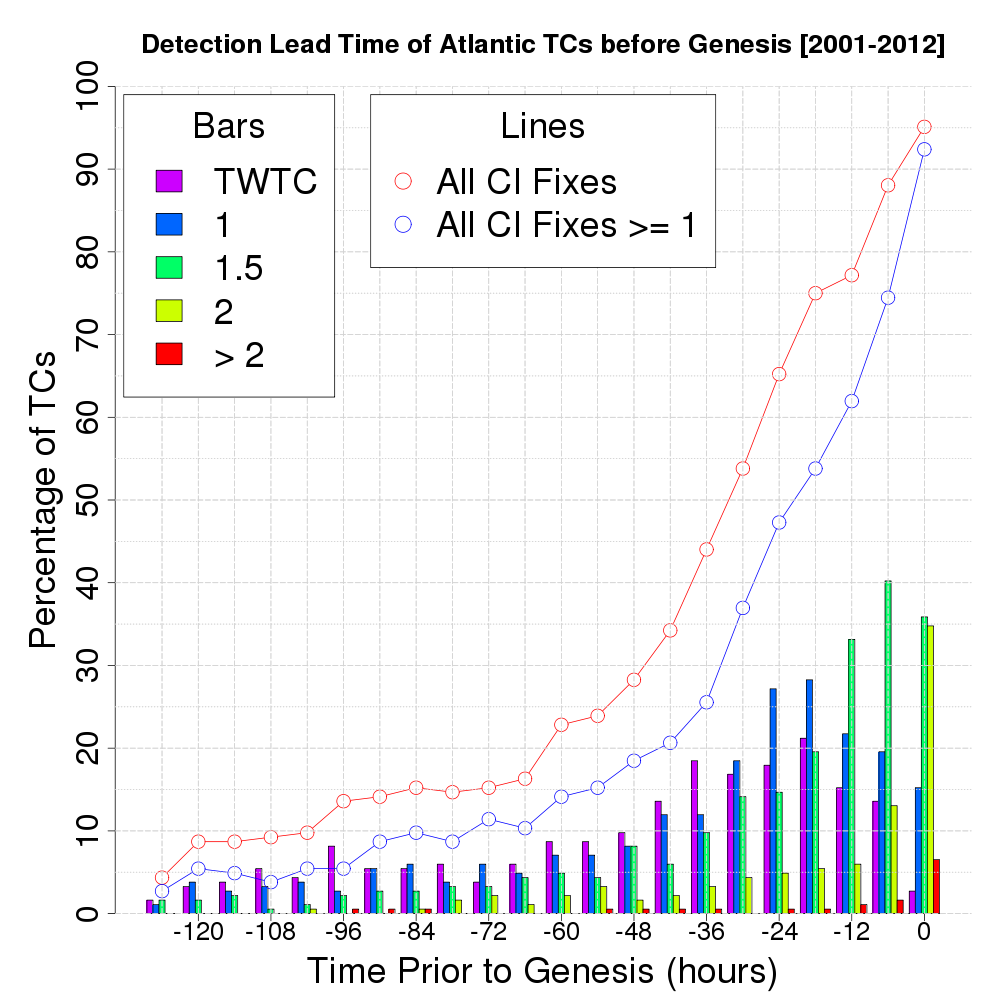
[ Detection Rate of Tropical Cyclones by Lead-time ]
[ Locations of Historical Dvorak Analyses ]
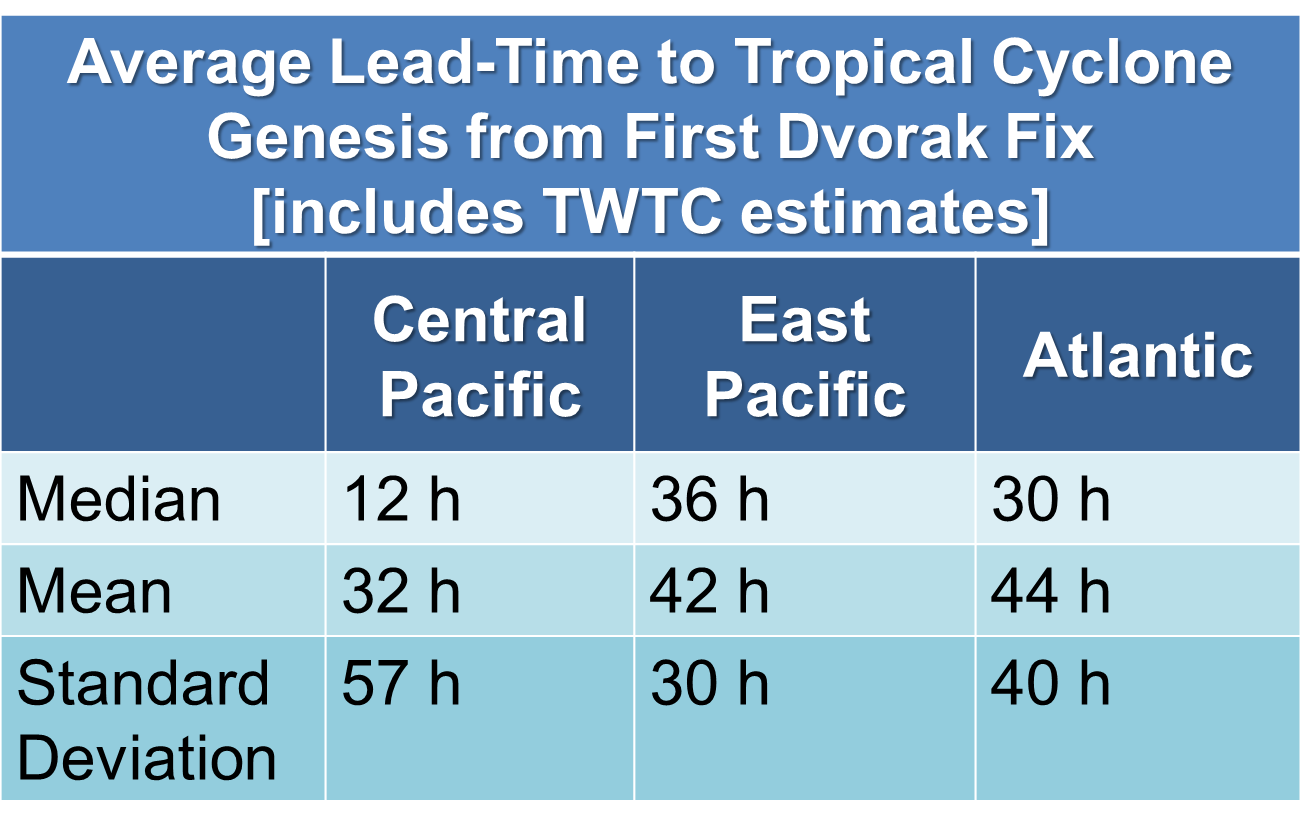
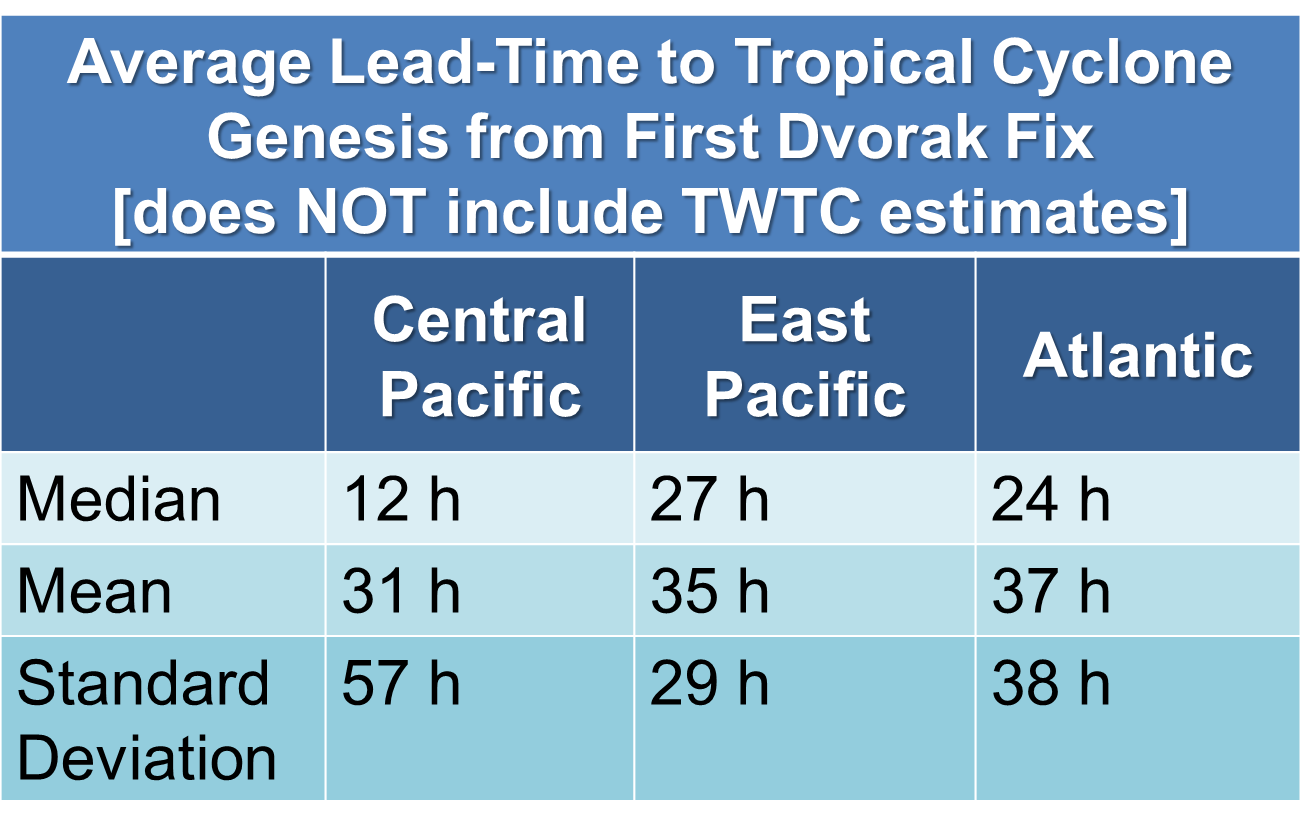
The following tables show the average lead-time between the first Dvorak analysis and tropical cyclone genesis rates. The top table includes Dvorak estimates that show a disturbance is "too weak to classify" (TWTC); the bottom table excludes this data. The Central Pacific is defined from 180° to 125°W and the East Pacific represents areas east of 125°W) in the northern hemisphere.
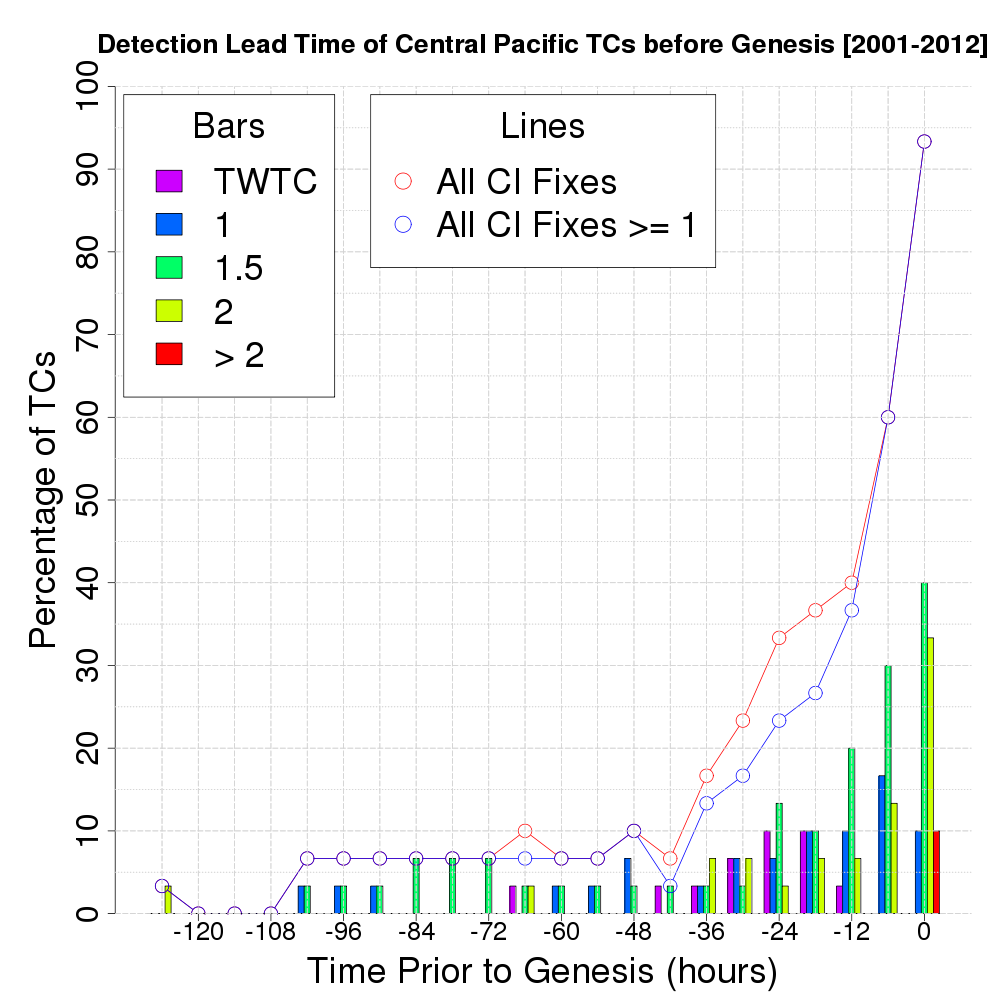
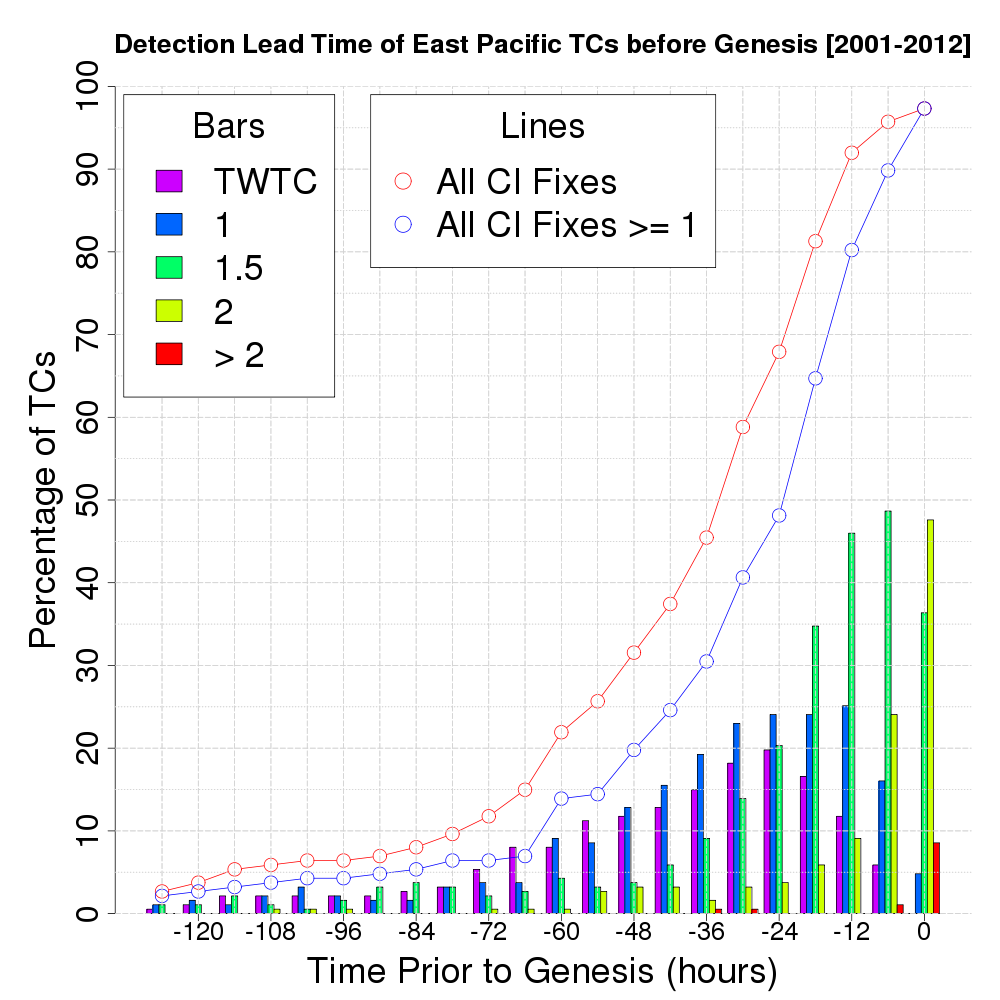
The following graphs show the percentage of time Dvorak fixes are available (at 6 hourly lead-time intervals) for disturbances that eventually developed into tropical cyclones. Data reflect Dvorak CI numbers from TAFB and CPHC in the Pacific central region (180° to 125°W), the Pacific eastern region (east of 125°W), and the Atlantic basin. Colored bars indicate the Dvorak CI classification; the red line (all CI fixes) sums all available Dvorak fixes including those "too weak to classify" (TWTC) at the specified lead time; the blue line (all CI fixes ≥1) aggregates only those Dvorak CI fixes at or above 1.
