Tropical Disturbance Climatology
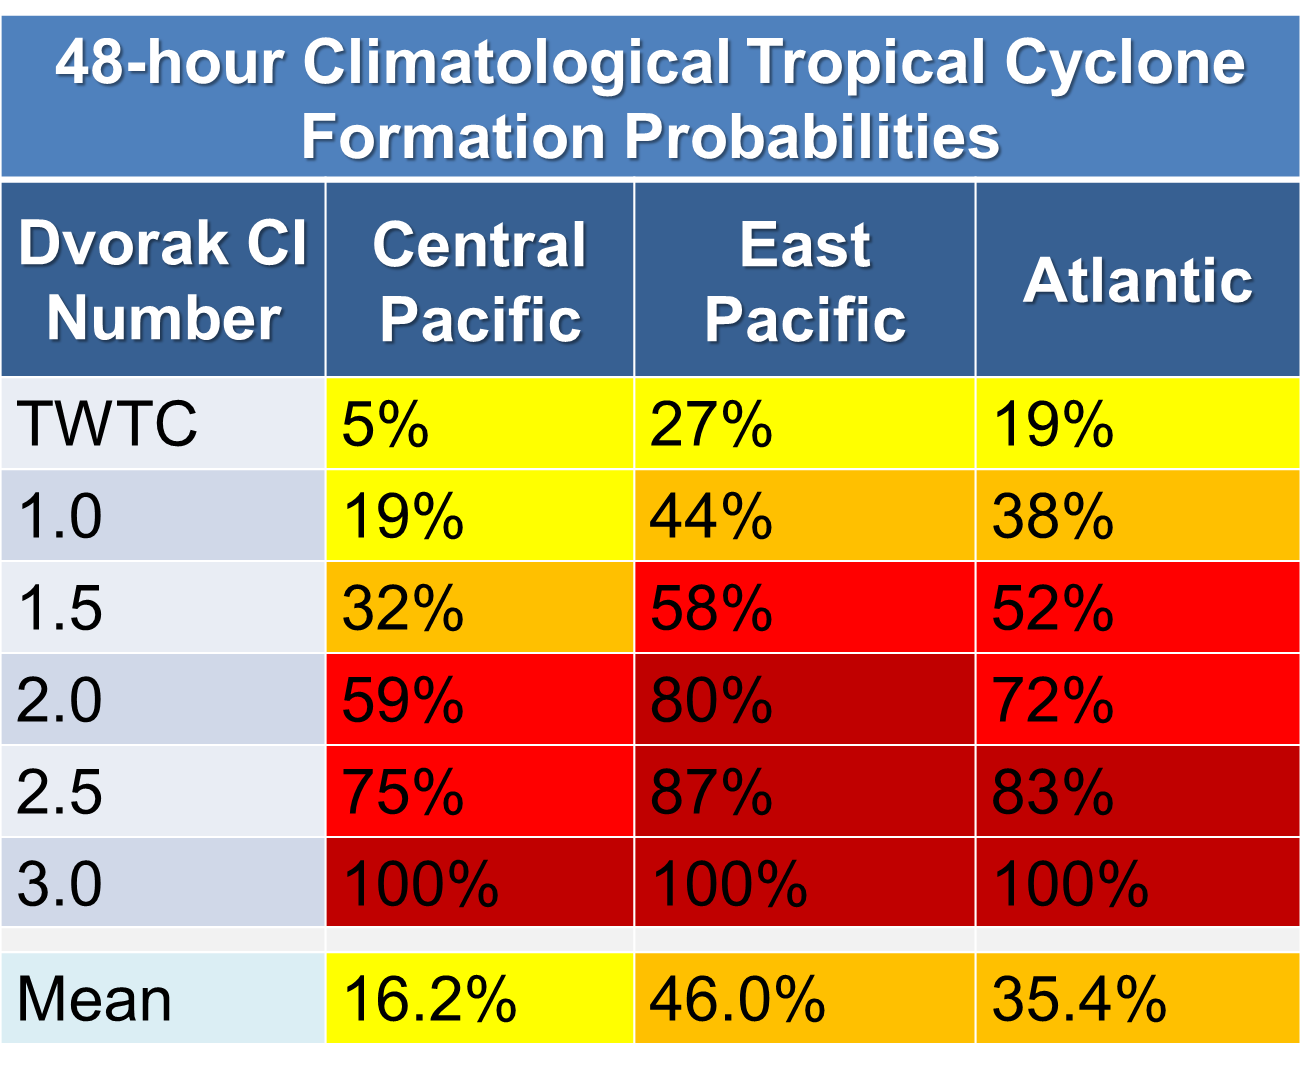
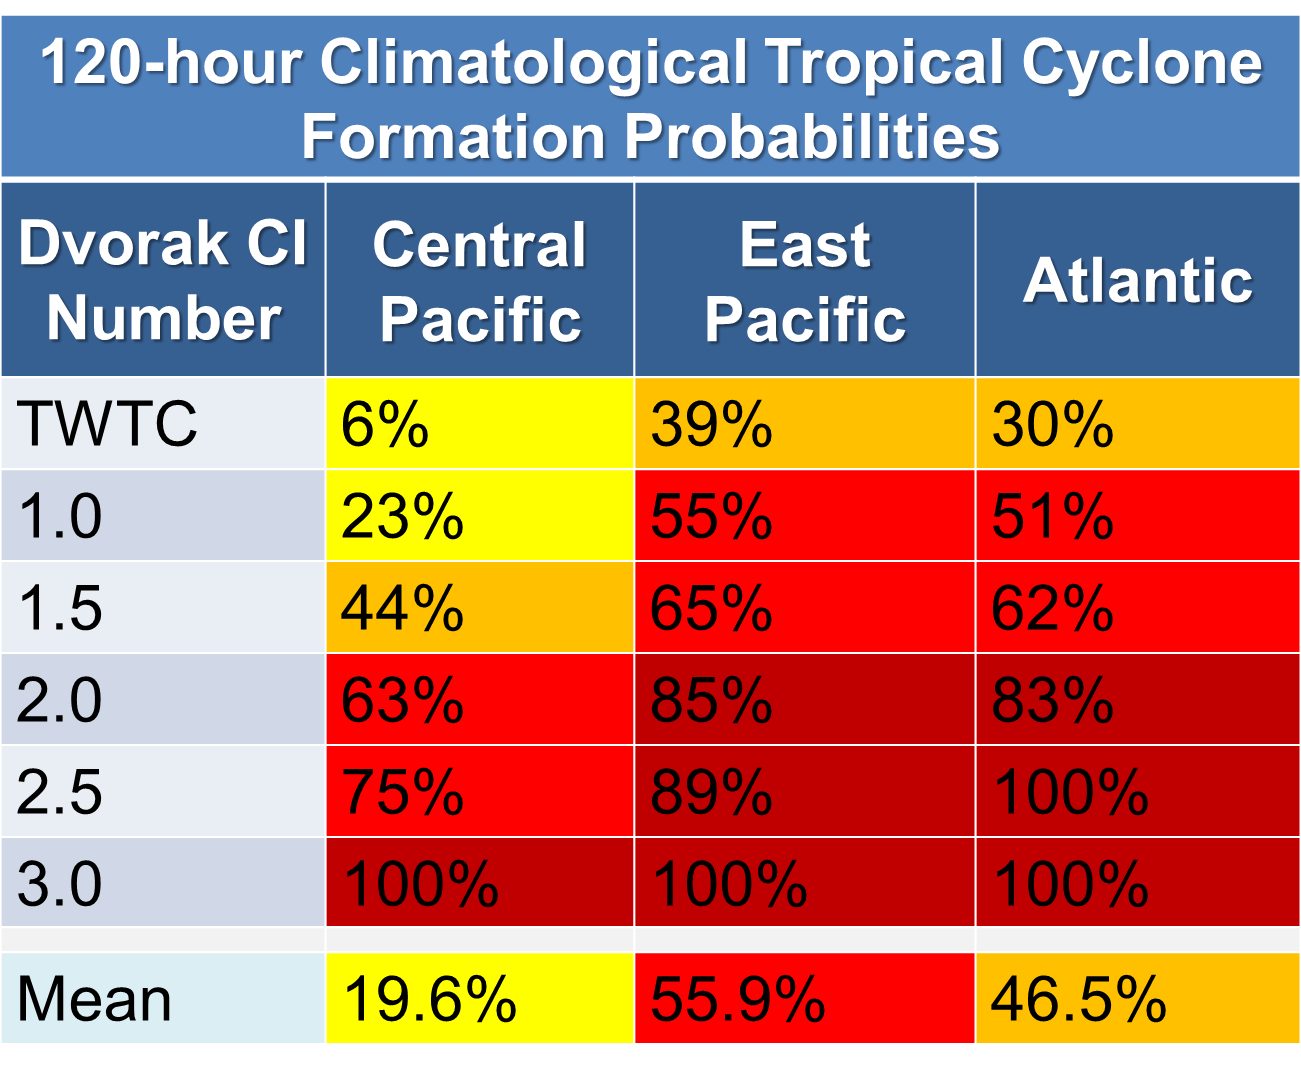
[ Comparision Tables between Development Regions ]
[ Graph of Probabilities at 6 hourly Intervals ]
[ Detection Rate of Tropical Cyclones by Lead-time ]
[ Locations of Historical Dvorak Analyses ]
The following tables show the average tropical cyclone genesis rates in the central North Pacific (from 180° to 125°W), the east North Pacific (east of 125°W), and the Atlantic basin. The mean represents the average genesis rate, regardless of the Dvorak CI (intensity) number. TWTC stands for disturbances that are "too weak to classify." Each table respectively displays the two day and five day tropical cyclone formation potential to match National Weather Service products. Yellow shading represents a "low" probability of less than 30%, orange shading is a "medium" probability of 30-50%, red shading is a "high" probability of greater than 50%, with dark red an 80% or above chance of genesis.