Tropical Disturbance Climatology
[ Comparision Tables between Development Regions ]
[ Graph of Probabilities at 6 hourly Intervals ]
[ Detection Rate of Tropical Cyclones by Lead-time ]
[ Locations of Historical Dvorak Analyses ]
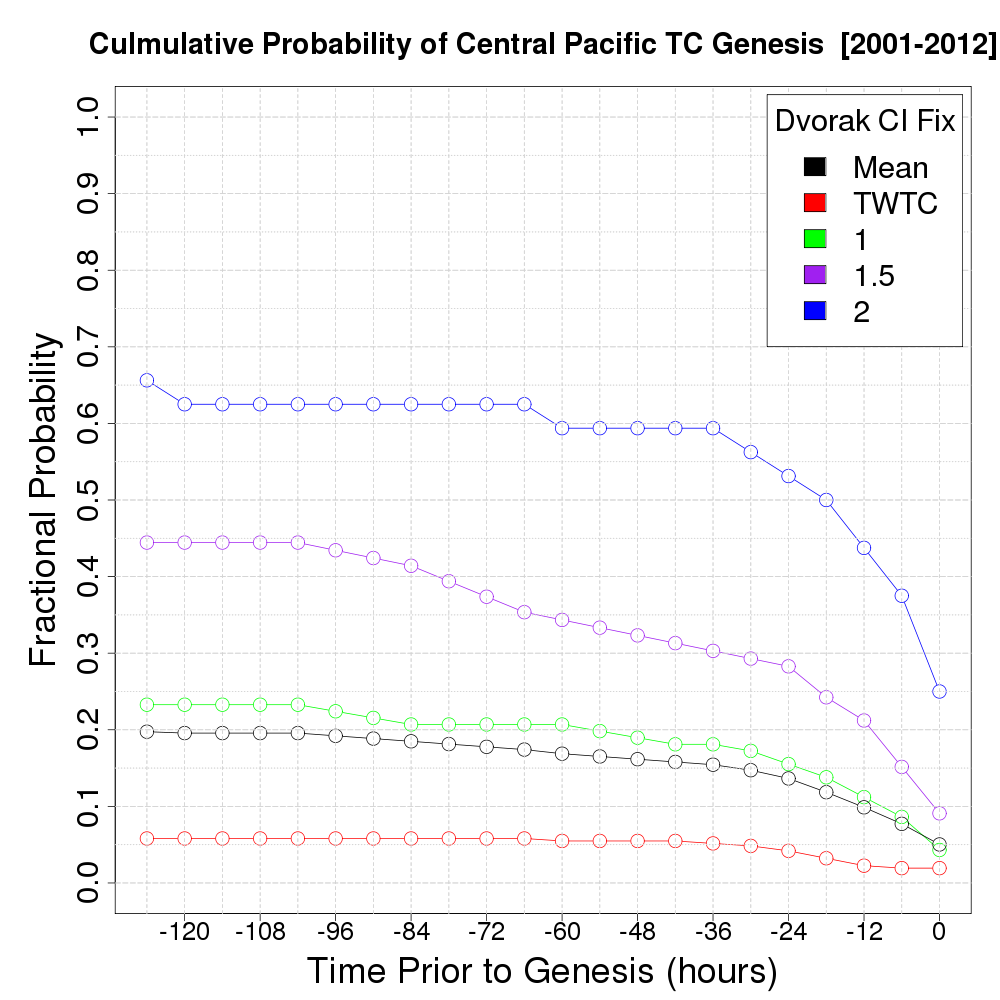
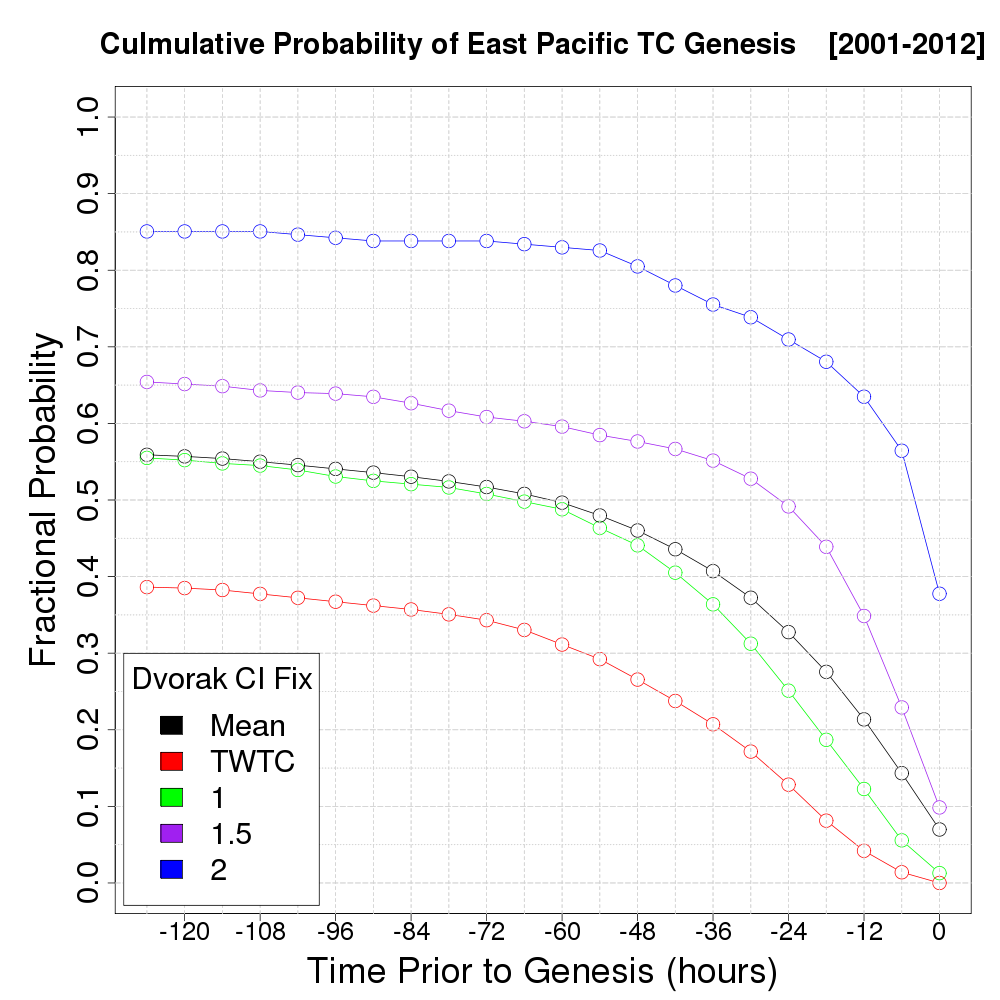
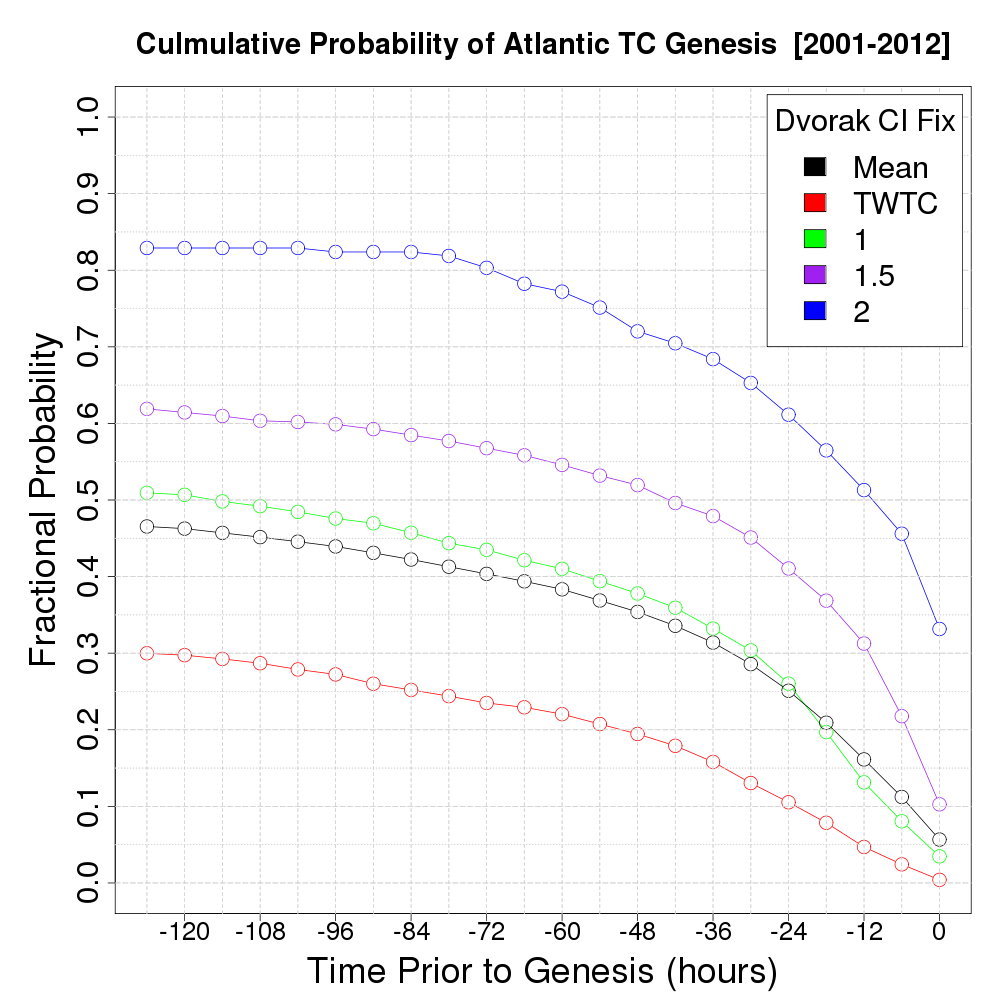
The graphs below depict the cumulative probabilities of tropical cyclogenesis in central North Pacific (from 180° to 125°W), the east North Pacific (east of 125°W), and the Atlantic basin. The colors represent the Dvorak CI number, as denoted in the legend. The abscissa represents the desired lead time of the genesis forecast and the ordinate plots the genesis probability for a given curve. Suppose there is a tropical disturbance with a Dvorak CI number of 1.0 east of 125°W in the Pacific. The 48-h climatological probability of genesis is found on the ordinate where the green line (for the CI number of 1.0) meets the 48-h lead time on the abscissa. In this case, one retrieves a probability of about 44%, meaning there is a 44% chance of genesis at some point within 48 h for this system based only on its Dvorak classification of 1.0. Using the same approach, the 48-h probability rises to about 57% for a system with a CI number of 1.5.