PRODUCT DESCRIPTION
NOTE: All products on these pages are experimental and should NOT be considered an official forecast. Please refer to the National Hurricane Center, Central Pacific Hurricane Center, or Joint Typhoon Warning Center for official forecasts.
OVERVIEW
This website provides experimental 48 h, 120 h, and 168 h tropical cyclone (TC) genesis probabilities based on genesis forecasts from global numerical models. The genesis probabilities are based on logistic regression models that were developed for each global model, each basin, and each forecast period. Genesis probabilities based on forecasts from the CMC, ECMWF, GFS, NAVGEM, and UKMET are available. In addition, guidance on the most likely time of genesis (MLTG) is generated by applying a random forest regression to significant predictors in the global model forecast fields.
INDIVIDUAL MODEL GRAPHICS
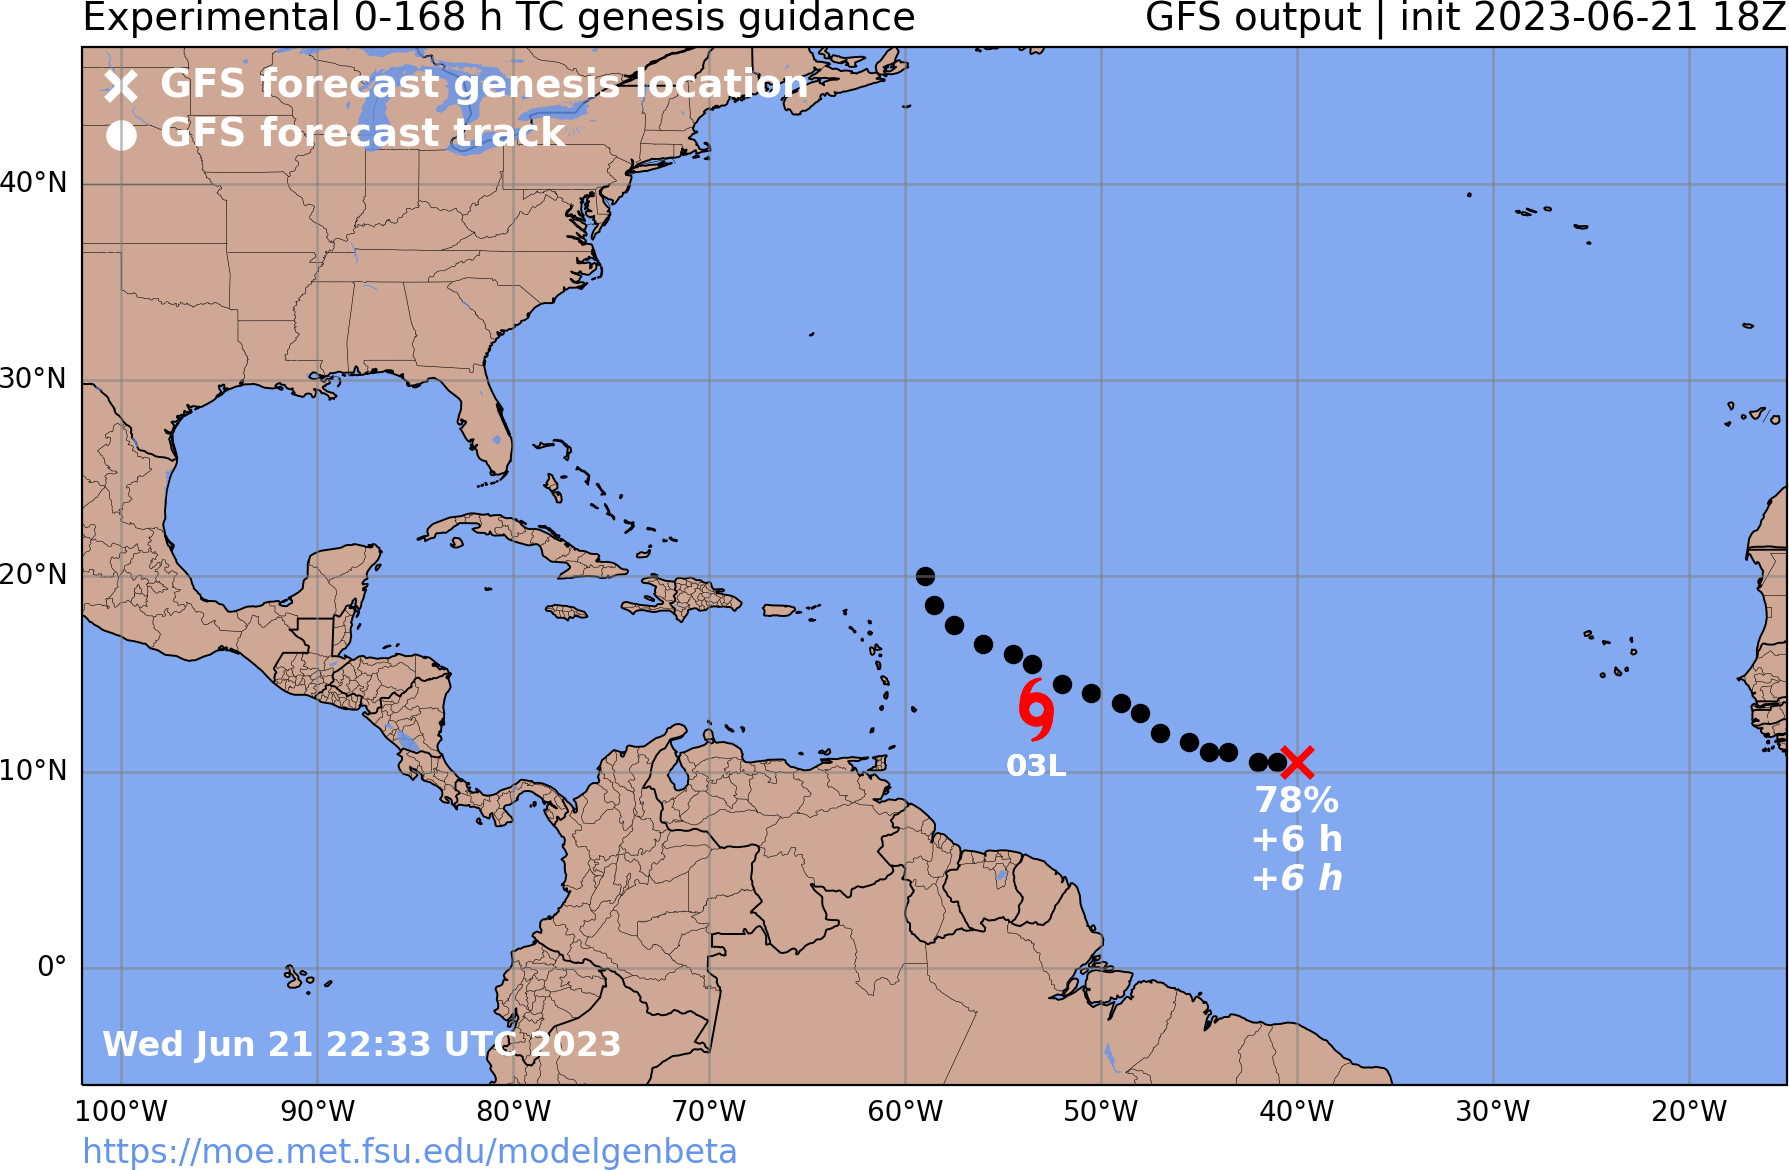
In order to view the genesis probabilities from each global model, hover over the "Graphics" tab and select the time period of interest. When the TC genesis criteria are met, these graphics will include a plot of the forecast genesis location, probability, and time relative to the model initialization time. Below the forecast genesis time identified by the tracker, the most likely time of genesis (MLTG) relative to the model initialization time is printed in italic font. The model-forecast post-genesis track is also plotted. If an active TC exists, its current location will be denoted by a TC symbol.
INDIVIDUAL MODEL TEXT OUTPUT PAGES
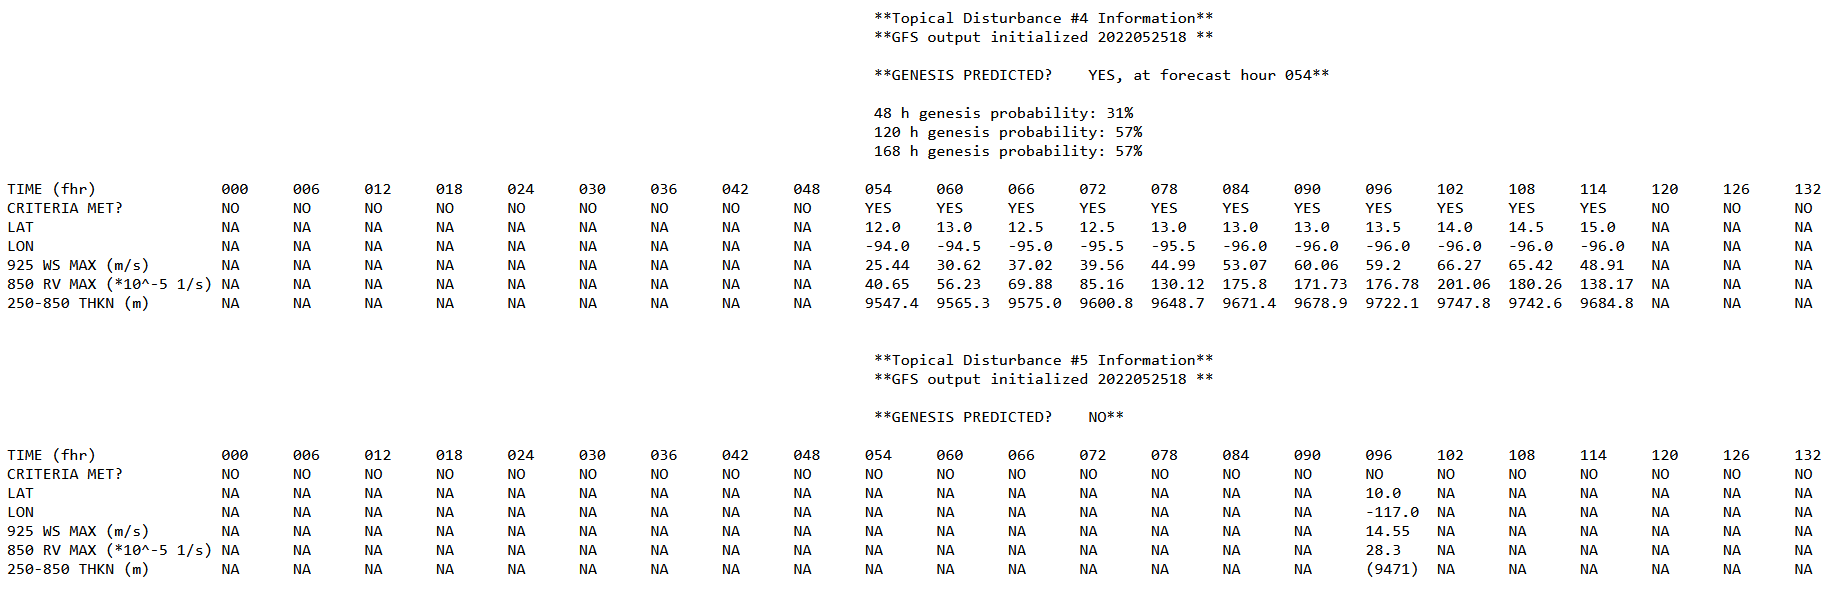
The same information that is displayed in the graphics is also available in text format. Hover over the "Text" tab and select the model of interest. Each model text page has three products: "Tropical Disturbance Information," "Tropical Cyclone Information," and "Model-Indicated TC History."
To provide added detail, the "Tropical Disturbance Information" page displays the values of the criteria used to define TC genesis (i.e., MSLP minimum, 850mb relative vorticity, 250-850mb thickness, and 925mb wind speed maxima). If a threshold value is not met, that value is enclosed in parentheses. This gives the user insight into why an area of low pressure may not have been classified as a TC according to our algorithm.
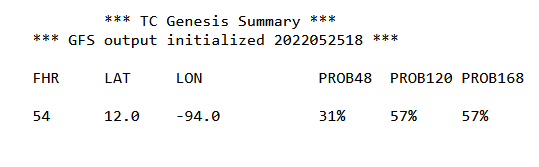
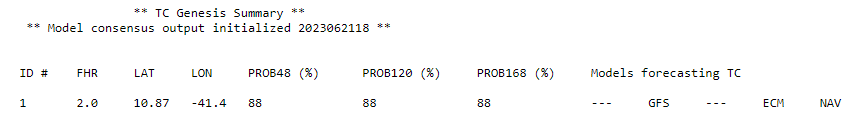
The "Tropical Cyclone Information" page provides the forecast genesis time and location, as well as the 48 h, 120 h, and 168 h genesis probabilities. This is intended to be a quick-reference or summary product.
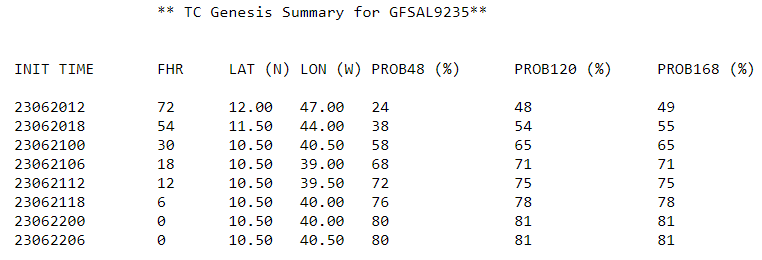
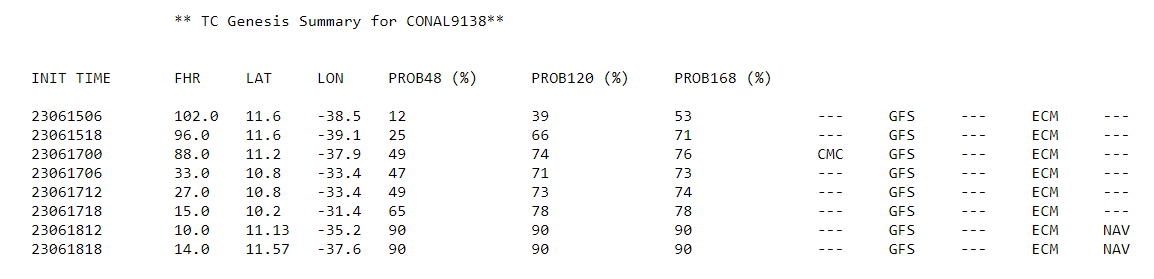
The "Model-Indicated TC History" page shows all genesis times, locations, and probabilities for each model-indicated TC. It gives the user information regarding how consistent a model has been at predicting genesis for a given system and how the genesis probabilities have evolved.
MULTI-MODEL CONSENSUS PROBABILITIES
When multiple global models predict the same TC genesis event, the individual genesis probabilities are combined to create one consensus probability for a given disturbance. In addition to the genesis probability, the mean location and a list of the models forecasting genesis for that disturbance are printed. The unweighted mean of the forecast genesis times from the tracker and the most likely genesis times (italic font) are also printed. This information is available graphically (located on the homepage for each basin) and in text format (under the "Text" tab). If data from one or more models are unavailable, the graphic will indicate which models are available and the probabilities will be enclosed in brackets. If an active TC exists, its current location will be denoted by a TC symbol. Consensus "Model Indicated TC History" information is also available in text format.
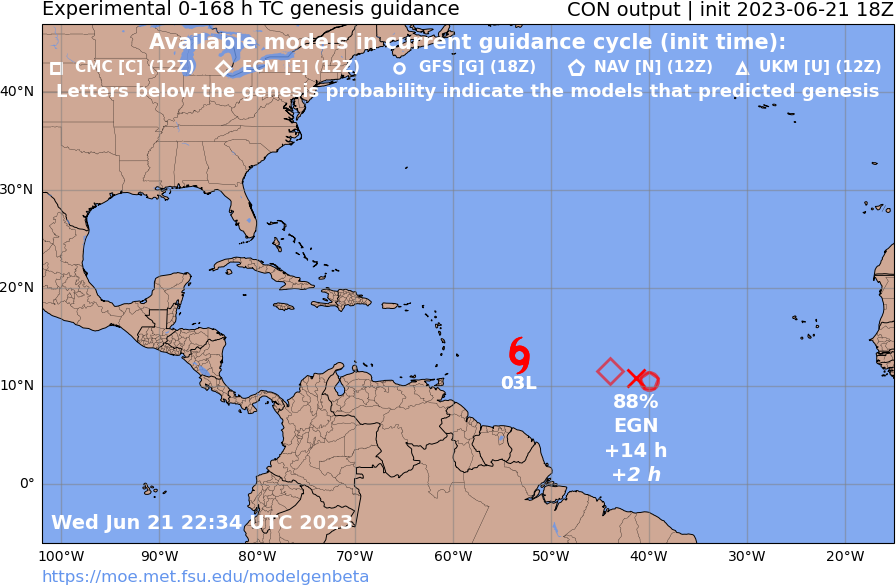
Occasionally, a user may subjectively conclude that two or more disturbances in the consensus output are actually forecasts for the same TC genesis event. In these situations, the user can select the basin and time period of interest and enter the relevant forecast genesis probabilities from the individual models using the manual consensus probability calculator available at the bottom of each individual model graphics page. The resulting probability from the calcuator represents what the consensus probability would be if the consensus tracker had grouped the individual forecasts as the same forecast TC genesis event.
Manual Consensus Probability Calculator
Basin Selection:
Forecast Hour:
Model Probabilities:
Please enter the genesis probability from each model. If the model is not forecasting TC genesis, enter 0.
Consensus Probability:
??
ENSEMBLE MODEL GRAPHICS
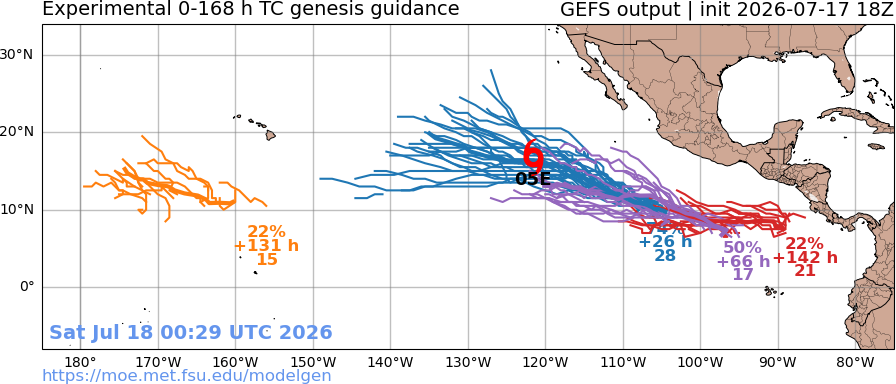
GEFS-based genesis probabilities are available under the "Ensemble" tab. The same TC tracker and regression equations applied to GFS output are applied to each GEFS ensemble member. Ensemble member tracks are then grouped for each disturbance, and tracks for each disturbance plotted in a separate, arbitrary color. The ensemble mean track is plotted as a thicker line. The genesis probability and genesis time relative to the model initialization time represent the ensemble mean values. The last number plotted is the number of ensemble members forecasting genesis for a given disturbance. If an active TC exists, its current location will be denoted by a TC symbol.
VERIFICATION
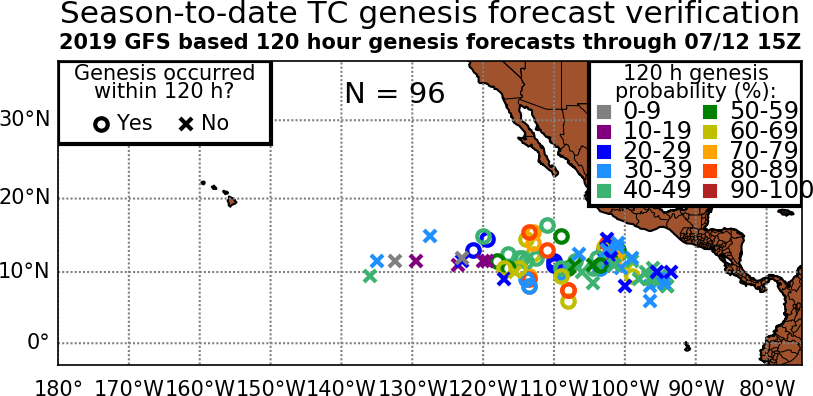
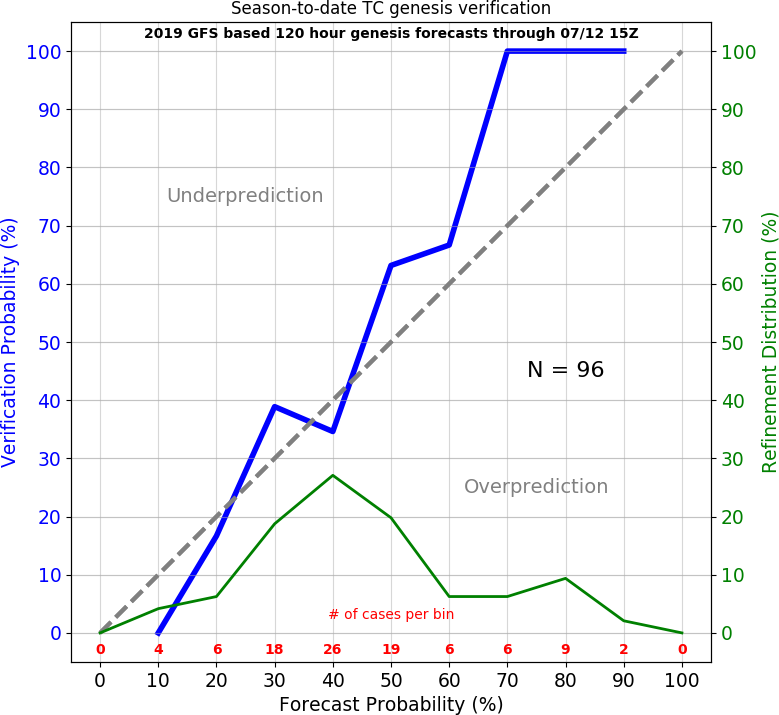
Season-to-date verification products are available for users to determine how well the probabilities are performing in real-time. Hover over the "Verification" tab and select "This Season". The geographic plots show the locations of genesis events. The colors reflect the genesis probability. The events are plotted as a circle when genesis did occur and as an "X" when genesis did not occur. Reliability diagrams are also provided. We caution that small sample sizes, especially at the beginning of the season, will limit the usefulness of the reliability diagrams.
DEFINING A TC IN THE MODEL FORECAST FIELDS
Each forecast of TC genesis is a result of several criteria being met. Specifically, for each model initialization cycle, the TC identification algorithm searches for:
1. A relative minimum in mean sea level pressure (MSLP) with at least one closed isobar at a 2mb interval.
2. A relative maximum in 850mb relative vorticity which is horizontally displaced less than 2 degrees lat/lon from the MSLP minimum.*
3. A relative maximum in 250-850mb thickness which is horiztonally displaced less than 2 degrees lat/lon from the MSLP minimum.*
4. The maximum wind speed at 925mb at any point less than 5 degrees lat/lon from the MSLP minimum.*
*Indicates that a threshold value must be exceeded.
If criteria 1-4 are met for at least one forecast time (e.g., forecast hour 12), then we would classify this as a 'tropical disturbance.' However, if criteria 1-4 exist for at least 24 consecutive forecast hours in the model cycle (e.g., forecast hours 12, 18, 24, 30, 36), then we would classify the system as a 'tropical cyclone' with a genesis time at forecast hour 12. This distinction is important for the text output pages (described in the next section).
ADDITIONAL RESOURCES
For additional information on the tracking algorithm and how each TC genesis event in the developmental dataset is classified, please refer to:
Halperin, D. J., H. E. Fuelberg, R. E. Hart, J. H. Cossuth, P. Sura, and R. J. Pasch, 2013: An evaluation of tropical cyclone genesis forecasts from global numerical models. Wea. Forecasting. 28 (6), 1423-1445.
Halperin, D. J., H. E. Fuelberg, R. E. Hart, and J. H. Cossuth, 2016: Verification of tropical cyclone genesis forecasts from global numerical models: Comparisons between the North Atlantic and eastern North Pacific basins. Wea. Forecasting. 31 (3), 947-955.
For additional information on the development of the logistic regression equations and real-time TC genesis guidance products, please refer to:
Halperin, D. J., R. E. Hart, H. E. Fuelberg, and J. H. Cossuth, 2017: The development and evaluation of a statistical-dynamical tropical cyclone genesis guidance tool. Wea. Forecasting. 32 (1), 27-46.