Features:
The script incorporates all the basic features of standard skewt/logP plots, including:
Function Usage:
The explanation below assumes you are familiar with GrADS, its control files and data files.
The function takes a maximum of four arguments (temp, dewpoint, wind speed, wind direction); however, you need not enter all four. Use '-1' for each argument you are not passing.
The control (.ctl) file for the data file is not fundamentally different from other GrADS control files. For example, the following might be a control file from which you would plot a skewt in GrADS:
Your driver script in GrADS might look like:
Please note that you must set your dimensions to ONE POINT in X,Y,and T before running the plotskew script.
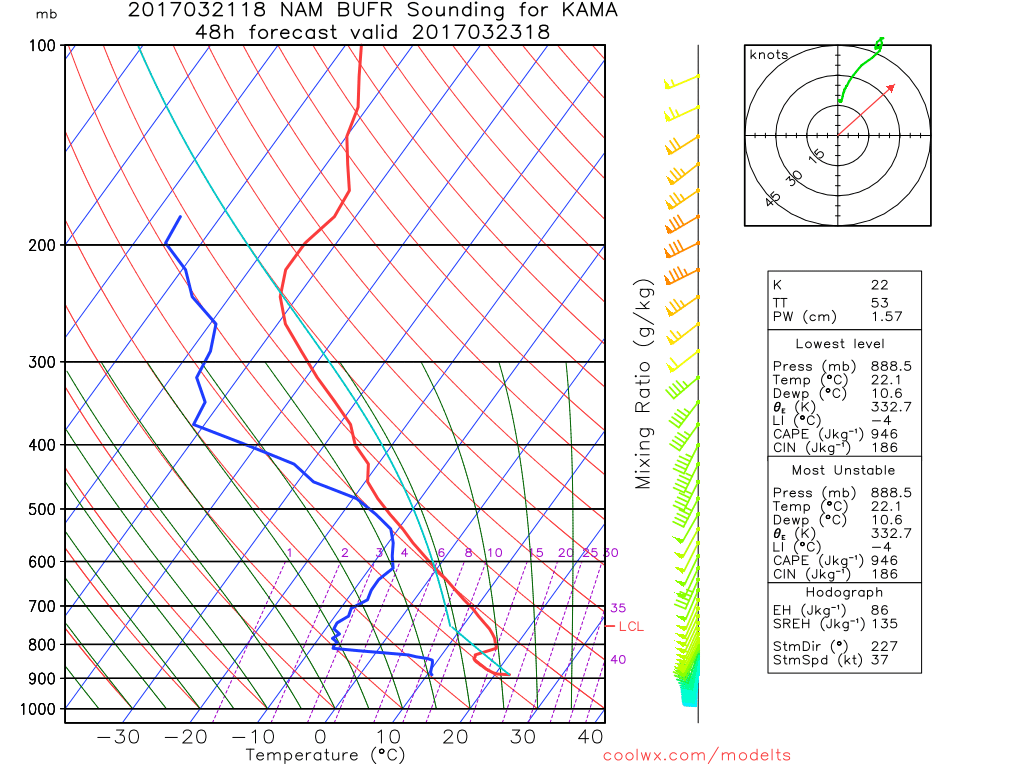
Sample Images:
Any remaining questions or problems with the function should be sent to:
Bob Hart
Last Updated: 21 March 2017
------------------------------------------
DSET ua.dat
TITLE Sample Control file for Skewt/LogP data - 100 grdpts and 11 levels at 10 hours
UNDEF -999
XDEF 10 LINEAR -70 1.0
YDEF 10 LINEAR 30 1.0
ZDEF 11 LEVELS 1000 925 850 700 500 400 300 250 200 150 100
TDEF 10 LINEAR 00Z28Dec1996 1hr
VARS 4
temp 11 99 temperature data
dewp 11 99 dewpoint data
wspd 11 99 windspeed data
wdir 11 99 wind direction data
ENDVARS
--------------------------------------------
"open ua.ctl"
"set t 4"
"set x 3"
"set y 5"
"set lev 1050 150"
rc=plotskew(temp,dewp,wspd,wdir)

function plotskew(sndtemp,snddewp,sndwspd,sndwdir)
.
. [rest of plotskew function available from this page]
.
-------------------------------------------------
Questions and Problems:
Florida State University Meteorology
rhart@fsu.edu