Robert Hart and Lindsey Day, Florida State University
Nearly all Atlantic TCs from 2004-2011 were utilized for this study. Ensemble spread is defined here as the average of the distances between the ensemble mean location and the ensemble members' locations. The resulting climatology of spread (in nautical miles) is given in the table below, with the thresholds of the Low (33%) and High (66%) terciles as a function of forecast hour. The Normal (Medium) tercile would fall in between the two numbers in the table.
| 6 | 12 | 18 | 24 | 30 | 36 | 42 | 48 | 54 | 60 | 66 | 72 | 78 | 84 | 90 | 96 | 102 | 108 | 114 | 120 | |
| Low Spread | 12.6 | 21.4 | 29.3 | 36.3 | 43.2 | 49.3 | 55.0 | 60.2 | 66.0 | 70.5 | 75.5 | 81.0 | 85.2 | 90.0 | 95.4 | 101.8 | 109.0 | 115.9 | 124.3 | 132.2 |
| High Spread | 22.2 | 34.3 | 45.4 | 55.3 | 65.2 | 74.4 | 82.7 | 90.5 | 98.8 | 107.8 | 115.1 | 124.6 | 133.7 | 144.7 | 156.8 | 164.3 | 173.3 | 185.6 | 198.3 | 209.4 |
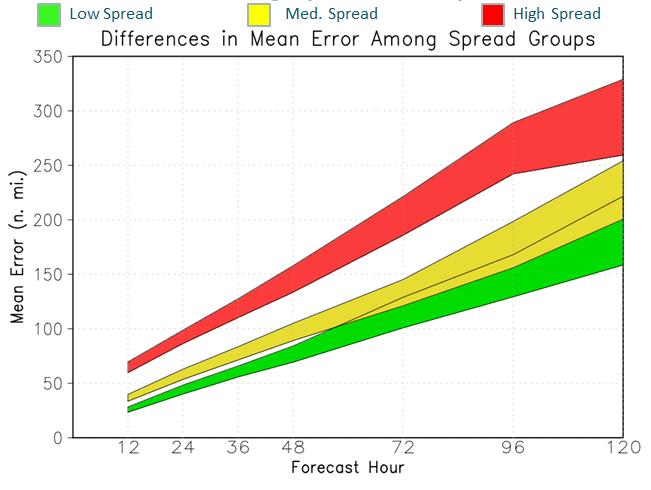
Note that just because the GEFS ensemble has anomalously high or low spread does not necessarily mean that the eventual forecast error of the ensemble mean will be anomalous. Correlations between spread and error average 0.8 at 12 hours but degrade to 0.6 by 96 hours and 0.5 by 120 hours. However, if we plot the mean error for each of the three spread terciles along with their 95% confidence intervals (below) we find that through 120 hours the intervals are separate for the low and high spread terciles. This argues that one can be reasonably confident that the eventual forecast track error for the GEFS mean will be higher during times of high tercile spread than during times of low tercile spread -- but note that any given storm can significantly depart from this relationship. Note that the same can be said of High Spread vs. Normal Spread, but not of Normal Spread vs. Low Spread.
The real-time output shown in the prior pages applies some of the results from this work to current and forecast tropical cyclones in the Atlantic. There are important caveats to remember when interpretting the real-time output shown:
Please contact Lindsey Day (lrd07@my.fsu.edu) or Robert Hart (rhart@fsu.edu) for more information.