Tropical Cyclone Track Probability
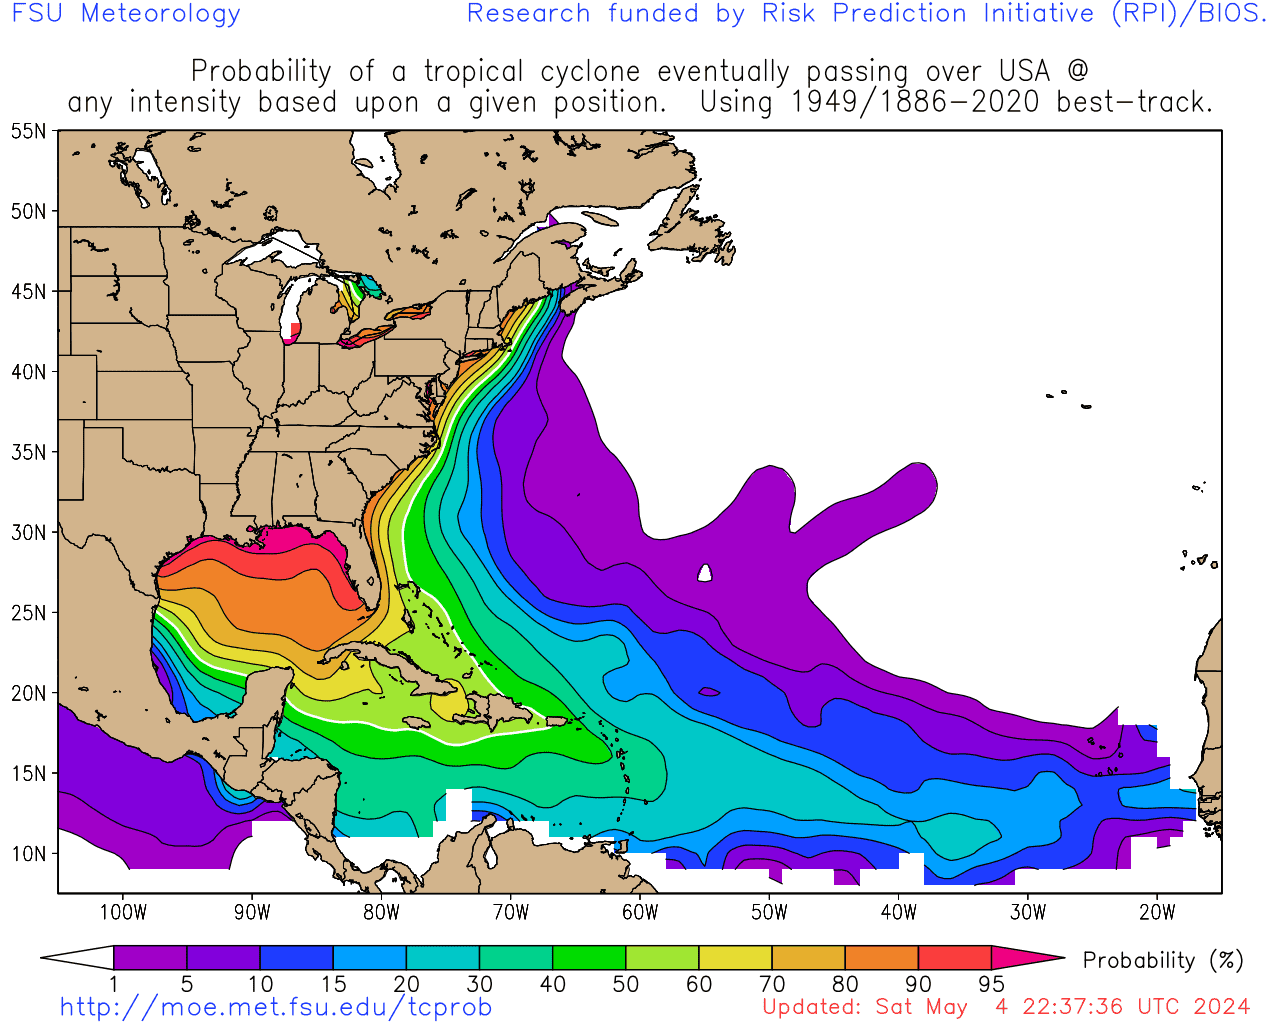
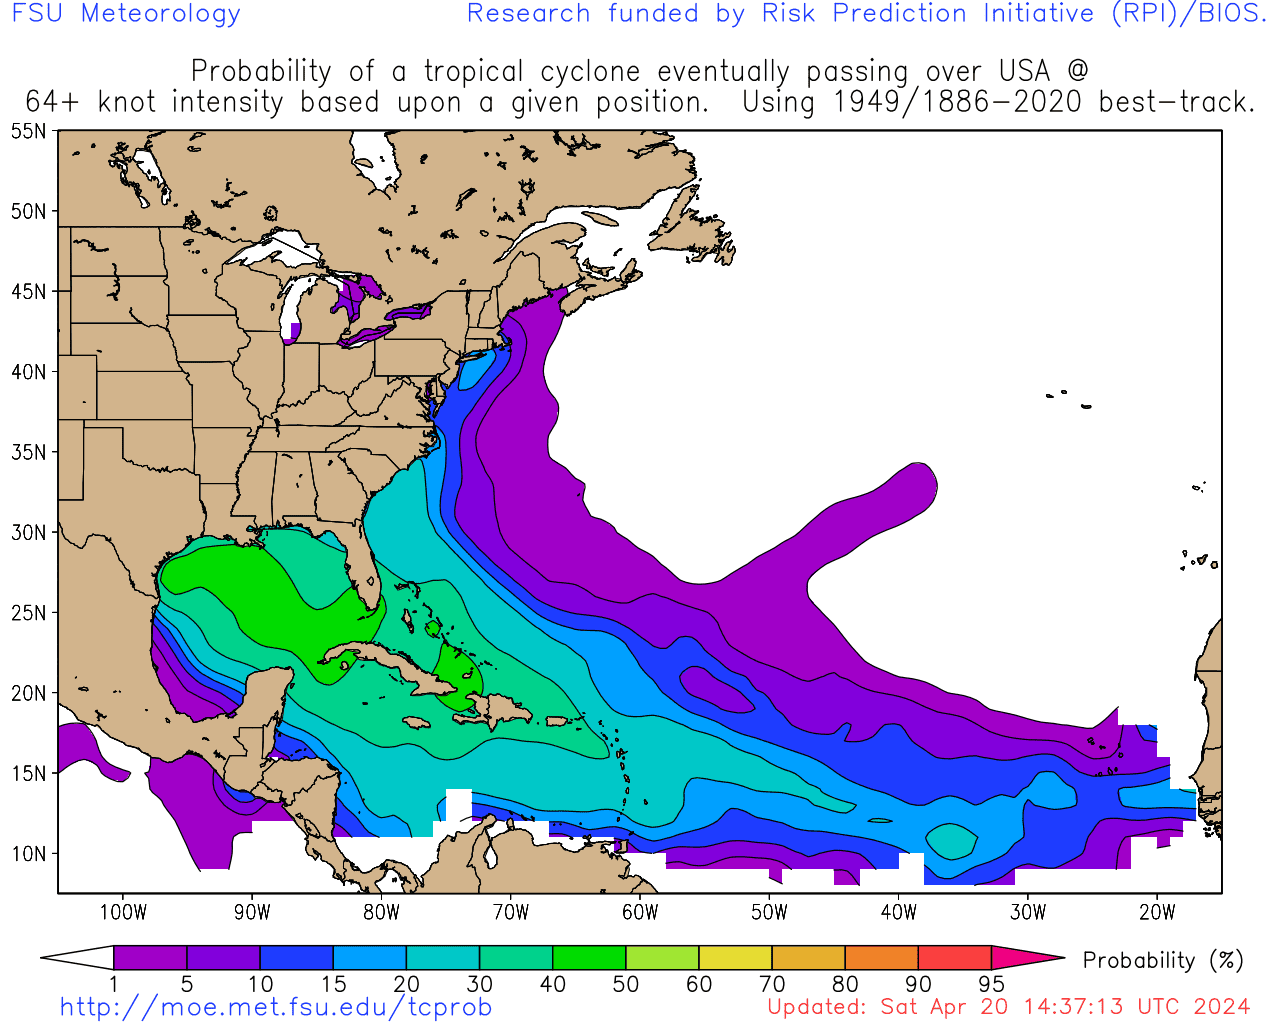
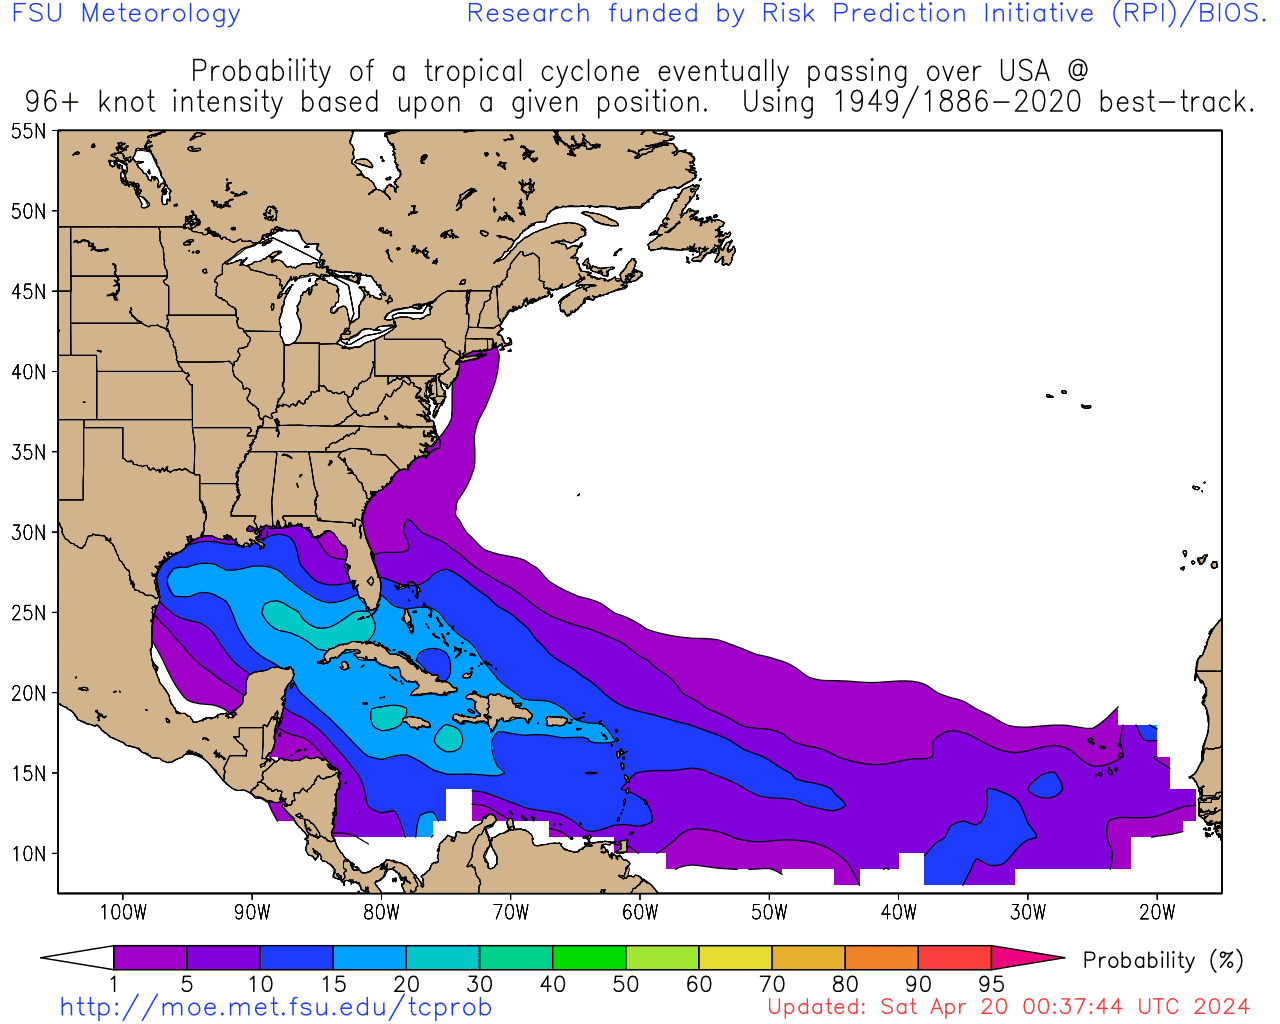
Historical probability of a tropical cyclone crossing various locations around the world
Robert Hart, Florida State University Meteorology, rhart@fsu.edu
Page created July 2009.
Funding provided by Risk Prediction Initiative (RPI) of the Bermuda Institute of Oceanic Sciences (BIOS),
and the Florida Catastrophic Risk Managment Center.
[ MOE MAIN PAGE | TCPROB MAIN PAGE | HELP/DOCUMENTATION | IMPORTANT DISCLAIMER ]
Last updated: Thu Jul 30 07:36:50 UTC 2026
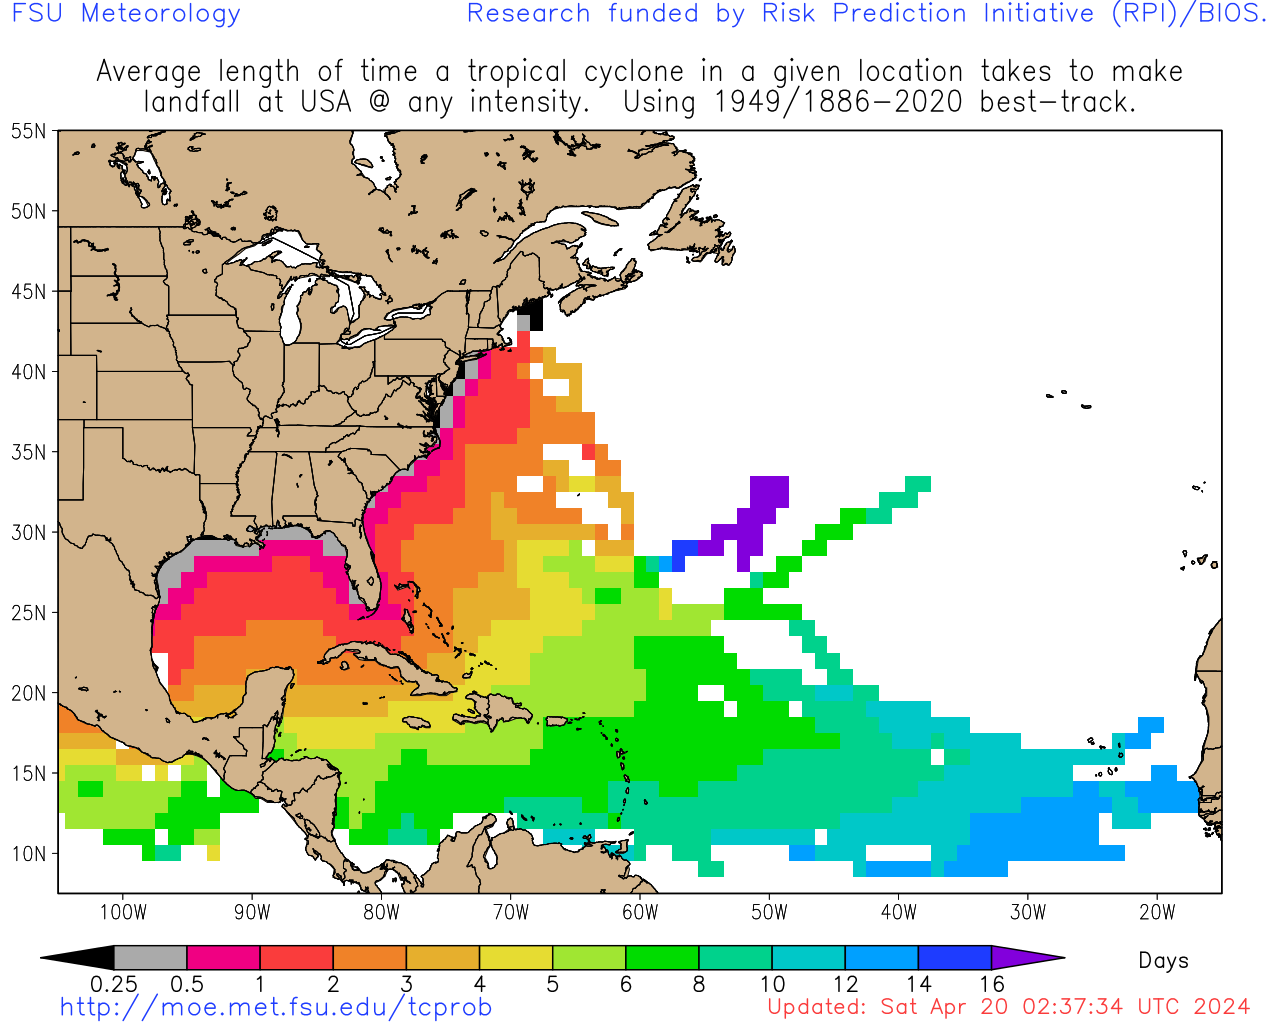
Climatologically most likely landfall region(s) for current storms, and
mean time from latest position to that landfall if it were to occur*:
Storm Rank Landfall/Crossing at
Any Intensity Landfall/Crossing at
Hurricane Intensity Landfall/Crossing at Major
Hurricane Intensity
No current TCs with climatological landfall probability ≥ 1%.
*Important note: These statistics ignore completely the current intensity or motion of the storm
and are based solely on a climatology based on the current position. They are prone to large forecast error.
Users should use only official forecasts for decisions, such as those provided by NHC, JTWC, and CHC.
Historical probability of a tropical cyclone crossing various locations around the world
Robert Hart, Florida State University Meteorology, rhart@fsu.edu
Page created July 2009.
Funding provided by Risk Prediction Initiative (RPI) of the Bermuda Institute of Oceanic Sciences (BIOS),
and the Florida Catastrophic Risk Managment Center.
[ MOE MAIN PAGE | TCPROB MAIN PAGE | HELP/DOCUMENTATION | IMPORTANT DISCLAIMER ]
Last updated: Thu Jul 30 07:36:50 UTC 2026
Climatologically most likely landfall region(s) for current storms, and
mean time from latest position to that landfall if it were to occur*:
| Rank | Any Intensity | Hurricane Intensity | Hurricane Intensity |
*Important note: These statistics ignore completely the current intensity or motion of the storm
and are based solely on a climatology based on the current position. They are prone to large forecast error.
Users should use only official forecasts for decisions, such as those provided by NHC, JTWC, and CHC.
Full breakdown of landfall probabilities for
each storm/region combination: