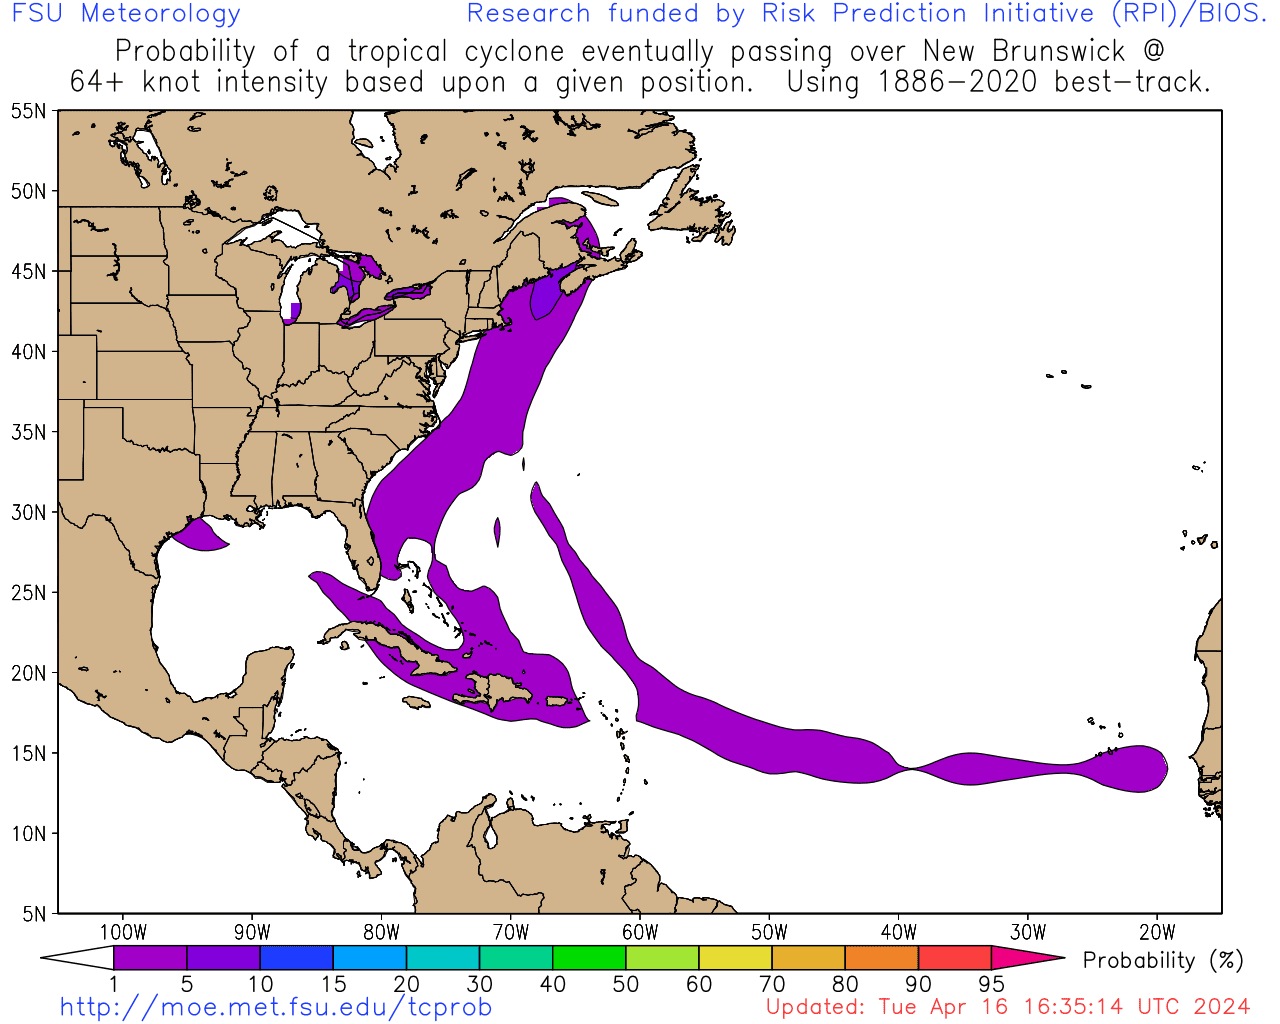
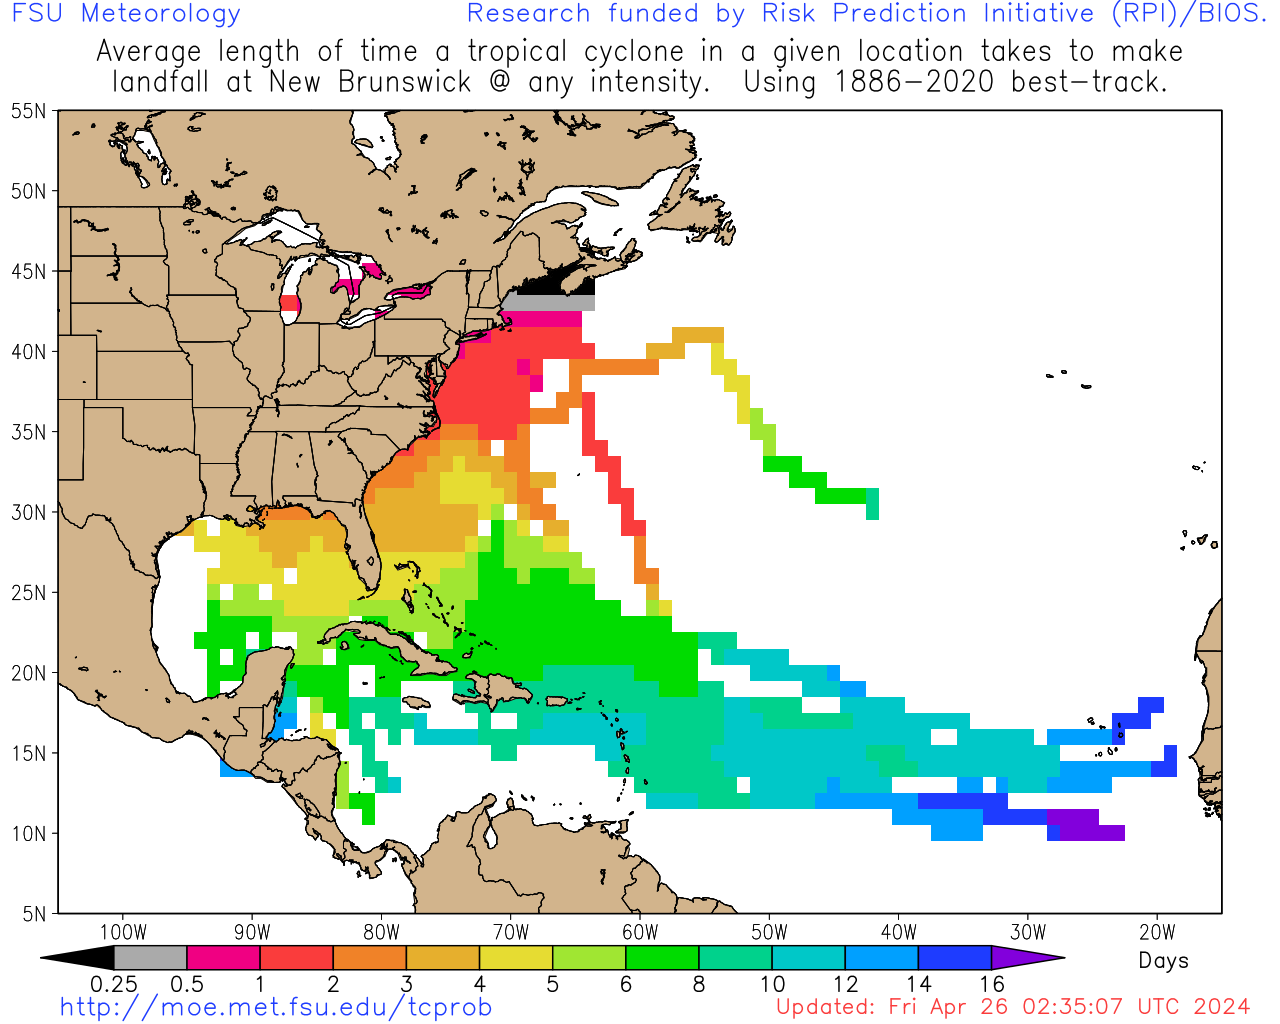
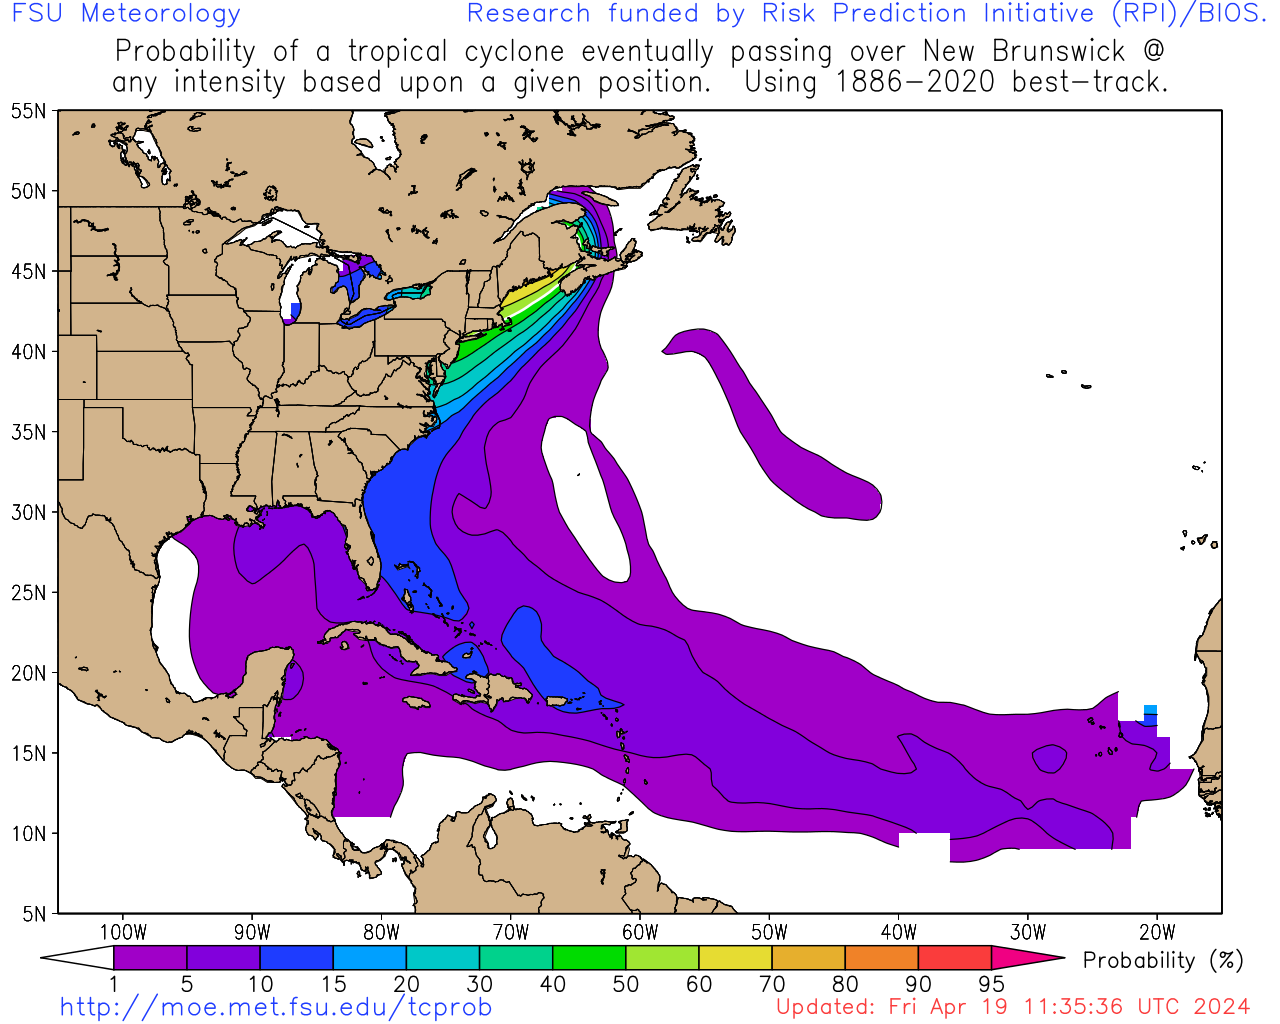
Tropical Cyclone Track Probability
Historical probability of a tropical cyclone crossing various locations around the world


Robert Hart, Florida State University Meteorology, rhart@fsu.edu

Funding provided by Risk Prediction Initiative (RPI) of the Bermuda Institute of Oceanic Sciences (BIOS),
and the Florida Catastrophic Risk Managment Center.


[ MOE MAIN PAGE | TCPROB MAIN PAGE | HELP/DOCUMENTATION | IMPORTANT DISCLAIMER ]


Last updated: Mon Sep 16 22:49:28 UTC 2024

Climatologically most likely landfall region(s) for current storms, and
mean time from latest position to that landfall if it were to occur*:

Storm
Rank
Landfall/Crossing at
Any Intensity
Landfall/Crossing at
Hurricane Intensity
Landfall/Crossing at Major
Hurricane Intensity
 07L-GORDON 
1
 Europe (28% △) @ 10 days 
 Bermuda or w/i 1 deg (7% ▽) @ 5.7 days 
 Bahamas Islands (4%) 
2
 Bermuda or w/i 1 deg (11%) @ 5.7 days 
 North Carolina (4%) 
 Georgia (2%) 
3
 Iceland (8%) @ 11 days 
 Bahamas Islands (4%) 
 Cuba (2%) 
 08L-INVEST 
1
 North Carolina (82% ▲▲) @ 14 hr 
 North Carolina (26%) @ 14 hr 
 North Carolina (6%) @ 14 hr 
2
 Virginia (21% △) @ 40 hr 
 South Carolina (7% ▽) @ 19 hr 
 South Carolina (1%) @ 19 hr 
3
 South Carolina (21% △) @ 19 hr 
 New York State (4%) @ 48 hr 
 New York State (1%) @ 48 hr 
 14W-BEBINCA 
1
 South Korea (9% ▼▼) 
  
  
2
 North Korea (8% ▼▼) 
  
  
3
 Japan (3% ▼) 
  
  
 15W-INVEST 
1
 Japan (20%) @ 6.0 days 
 Japan (12%) @ 6.0 days 
 Philippines (3%) @ 4.9 days 
2
 China (15%) @ 6.0 days 
 Philippines (7%) @ 4.9 days 
 Japan (3%) @ 6.0 days 
3
 Philippines (9%) @ 4.9 days 
 Taiwan (4%) @ 5.1 days 
 China (2%) @ 6.0 days 
 98W-INVEST 
1
 Philippines (79% ▲▲) @ 7 hr 
 Philippines (44% ▲) @ 7 hr 
 Philippines (19% △) @ 7 hr 
2
 China (49% ▲) @ 3.0 days 
 China (18% △) @ 3.0 days 
 China (2%) @ 3.0 days 
3
 Vietnam (20% △) @ 4.3 days 
 Taiwan (5% ▽) @ 47 hr 
 Taiwan (1% ▽) @ 47 hr 

*Important note: These statistics ignore completely the current intensity or motion of the storm
and are based solely on a climatology based on the current position. They are prone to large forecast error.
Users should use only official forecasts for decisions, such as those provided by NHC, JTWC, and CHC.


Full breakdown of landfall probabilities for
each storm/region combination:
Basin, TC#, and
TC Name (right)
07L
GORDON
08L
INVEST
14W
BEBINCA
15W
INVEST
98W
INVEST
Basin, TC#, and
TC Name (left)
Map icon (right)
Magenta
Red
Orange
Light
Orange
Yellow
Map icon (left)
TC LatLon (right)
Region (below)
19.0N
48.3W
33.4N
78.5W
32.1N
118.3E
17.6N
140.5E
17.8N
122.4E
TC LatLon (left)
Region (below)
Alabama
1-0-0
1-0-0
Alabama
Antigua Antigua
Any Land
22-12-4
73-25-3
ONLAND
45-32-11
86-54-20 ▲▲
Any Land
Arkansas
1-0-0
Arkansas
Australia Australia
Azores
5-2-0
Azores
Bahamas
Islands
4-4-4
1-0-0
Bahamas
Islands
Barbados Barbados
Barbuda
1-1-1
Barbuda
Belize Belize
Bermuda
or w/i 1 deg
11-7-1
2-0-0
Bermuda
or w/i 1 deg
California California
Chemung, NY
or w/i 1deg
1-0-0
3-0-0
Chemung, NY
or w/i 1deg
China
ONLAND
15-4-2
49-18-2
China
Connecticut
2-2-1
10-2-1
Connecticut
Costa Rica Costa Rica
Cuba
2-2-2
Cuba
Dominica Dominica
Dominican
Republic
Dominican
Republic
Europe
28-0-0
19-0-0
Europe
FL Big Bend
83W-85W
1-0-0
FL Big Bend
83W-85W
FL East Coast
PBI-DAB
FL East Coast
PBI-DAB
FL Keys
or w/i 2deg
2-1-1
1-0-0
FL Keys
or w/i 2deg
FL NE Coast
DAB North
1-0-0
FL NE Coast
DAB North
FL Panhandle
west of 85W
FL Panhandle
west of 85W
FL South
of 27N
1-1-1
1-0-0
FL South
of 27N
FL West Coast
FMY-29N
1-1-0
FL West Coast
FMY-29N
Florida
1-1-1
1-0-0
Florida
Georgia
3-2-2
3-1-0
Georgia
Greenland
2-0-0
1-0-0
Greenland
Grenada Grenada
Guadeloupe Guadeloupe
Guam
or w/i 1deg
Guam
or w/i 1deg
Haiti Haiti
Hawaii Hawaii
Honduras Honduras
Hong Kong
1-0-0
8-4-1
Hong Kong
Iceland
8-0-0
6-0-0
Iceland
India India
Map icon (right)
Magenta
Red
Orange
Light
Orange
Yellow
Map icon (left)
Basin, TC#, and
TC Name (right)
07L
GORDON
08L
INVEST
14W
BEBINCA
15W
INVEST
98W
INVEST
Basin, TC#, and
TC Name (left)
Jamaica Jamaica
Japan
3-0-0
20-12-3
4-1-0
Japan
Long Island
2-2-1
12-3-1
Long Island
Louisiana Louisiana
Madagascar Madagascar
Maine
5-0-0
13-2-0
Maine
Martinique Martinique
Maryland
4-0-0
13-1-0
Maryland
Massachusetts
5-2-0
17-3-0
Massachusetts
Mexico Mexico
Mississippi
1-0-0
Mississippi
New Brunswick
3-0-0
14-1-0
New Brunswick
New England
6-2-1
20-4-1
New England
New Jersey
2-0-0
9-1-0
New Jersey
New York State
5-2-1
18-4-1
New York State
Newfoundland
4-2-0
12-1-0
Newfoundland
Nicaragua Nicaragua
North Carolina
5-4-0
82-26-6 ▲▲
North Carolina
North Korea
8-0-0 ▼▼
1-0-0
1-0-0
North Korea
Nova Scotia
4-0-0
12-3-0
Nova Scotia
Pennsylvania
4-0-0
8-1-0
Pennsylvania
Philippines
9-7-3
79-44-19 ▲▲
Philippines
Prince Edward
Island
2-0-0
7-2-0
Prince Edward
Island
PSU
or w/i 1deg
1-0-0
5-0-0
PSU
or w/i 1deg
Puerto Rico Puerto Rico
Rhode Island
5-2-0
Rhode Island
S New England
5-2-1
17-3-1
S New England
South Carolina
2-2-0
21-7-1
South Carolina
South Korea
9-0-0 ▼▼
5-1-0
2-0-0
South Korea
Sri Lanka Sri Lanka
St. Lucia St. Lucia
St. Vincent &
Grenadines
St. Vincent &
Grenadines
Taiwan
6-4-1
7-5-1
Taiwan
Tallahassee
or w/i 0.5deg
Tallahassee
or w/i 0.5deg
Tennessee
1-0-0
2-0-0
Tennessee
Texas
1-1-0
Texas
Turks & Caicos
Islands
1-0-0
Turks & Caicos
Islands
USA
9-8-4
64-23-3 ▲▲
USA
Vietnam
3-2-0
20-4-0
Vietnam
Virginia
4-2-0
21-2-0
Virginia
Region (above)
TC LatLon (right)
19.0N
48.0W
33.0N
78.0W
32.0N
118.0E
17.0N
140.0E
17.0N
122.0E
Region (above)
TC LatLon (left)
Map icon (right)
Magenta
Red
Orange
Light
Orange
Yellow
Map iconr (left)
Basin, TC#, and
TC Name (right)
07L
GORDON
08L
INVEST
14W
BEBINCA
15W
INVEST
98W
INVEST
Basin, TC#, and
TC Name (left)